-
 Do you want to understand the OOTB configuration and functionality of financial management? In this class, we will review the OOTB objects, views, views, and functions of financial plans, rates, and other related areas. We will cover both classic and new UX highlighting differences.
 -
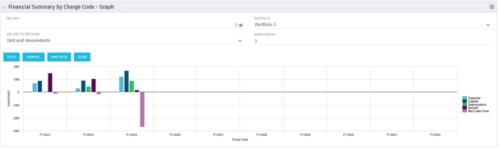 The Financial Summary by Charge Code - Graph portlet displays yearly charge code financial information across all projects in a bar graph. This portlet provides management with a snapshot of all projects’ financial information totaled and sorted by expense, capital, depreciation, benefit, and net cash flow. The depreciation is calculated based on a straight line method. The user may filter on OBS unit and/or portfolio to narrow down the search results.
 -
The Financial Summary by Charge Code - Graph portlet displays yearly charge code financial information across all projects in a bar graph. This portlet provides management with a snapshot of all projects’ financial information totaled and sorted by expense, capital, depreciation, benefit, and net cash flow. The depreciation is calculated based on a straight line method. The user may filter on OBS unit and/or portfolio to narrow down the search results.
-
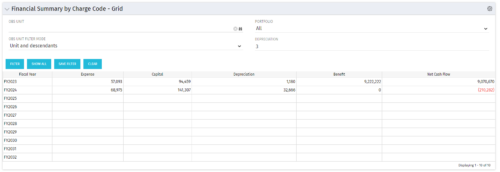 The Financial Summary by Charge Code – Grid portlet displays yearly charge code financial information across all projects. This portlet provides management with a snapshot of all projects’ financial information totaled and sorted by expense, capital, depreciation, benefit, and net cash flow. The depreciation is calculated based on a straight-line method. The user may filter on OBS unit and/or portfolio to narrow down the search results.
 -
The Financial Summary by Charge Code – Grid portlet displays yearly charge code financial information across all projects. This portlet provides management with a snapshot of all projects’ financial information totaled and sorted by expense, capital, depreciation, benefit, and net cash flow. The depreciation is calculated based on a straight-line method. The user may filter on OBS unit and/or portfolio to narrow down the search results.
-
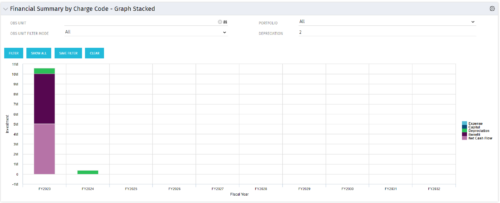 The Financial Summary by Charge Code – Graph Stacked portlet displays yearly charge code financial information across all projects in a stacked bar graph. This portlet provides management with a snapshot of all projects’ financial information totaled and sorted by expense, capital, depreciation, benefit, and net cash flow. The depreciation is calculated based on a straight-line method. The user may filter on OBS unit and/or portfolio to narrow down the search results.
 -
The Financial Summary by Charge Code – Graph Stacked portlet displays yearly charge code financial information across all projects in a stacked bar graph. This portlet provides management with a snapshot of all projects’ financial information totaled and sorted by expense, capital, depreciation, benefit, and net cash flow. The depreciation is calculated based on a straight-line method. The user may filter on OBS unit and/or portfolio to narrow down the search results.
-
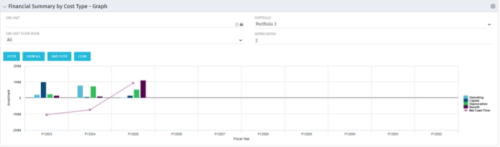 The Financial Summary by Cost Type - Graph provides a visual stacked graph for each years financial picture beginning with current year and going forward into the future. It will show the user where they need to concentrate their efforts in order to meet financial commitments.
 -
The Financial Summary by Cost Type - Graph provides a visual stacked graph for each years financial picture beginning with current year and going forward into the future. It will show the user where they need to concentrate their efforts in order to meet financial commitments.


Copyright 2023 • Rego Consulting Corporation • Privacy Policy