-
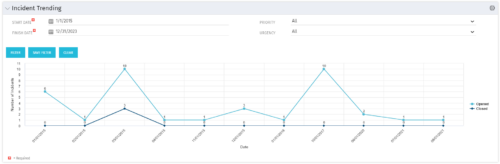 The Incident Trending portlet all opened and closed incidents within a certain time frame. This portlet will show trends in incidents over previous months and allows for analysis of as to the root cause in a spike of incidents. The information may be filtered by date range, urgency and priority.
 -
The Incident Trending portlet all opened and closed incidents within a certain time frame. This portlet will show trends in incidents over previous months and allows for analysis of as to the root cause in a spike of incidents. The information may be filtered by date range, urgency and priority.
-
The Incident Trending portlet all opened and closed incidents within a certain time frame. This portlet will show trends in incidents over previous months and allows for analysis of as to the root cause in a spike of incidents. The information may be filtered by date range, urgency and priority.
-
 The Resource Management training document provides an in-depth guide to resource management. This presentation is designed to provide resource managers with an overview to managing time, inputting users and roles, adjust allocations, availability and more within Clarity’s resource management module. This guide provides step-by-step instructions as well as detailed screenshots to ensure that the learning curve for your resource managers is minimal.
 -
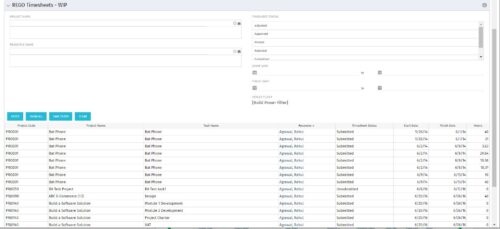 The REGO Timesheets - WIP portlet displays timesheet information for timesheets that have a status of posted but have not been posted to the WIP tables. This does not include records hung up in invalid transactions. Users can further narrow their search by Project Name, Resource Name, Timesheet Status, Start Date, and Finish Date.
 -
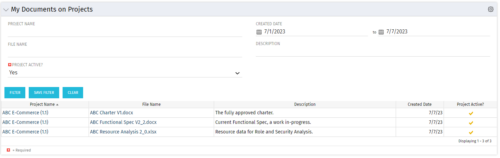 This Portlet allows users to quickly access Documents they uploaded into Projects via the Classic UI à Collaboration tab or via the New UX Documents module. Clicking on the File Name downloads the file, clicking on the Options gear allows users to export the list to Excel.
 -
 This tech-trick defines how to run a Jaspersoft report using Rest API
 -
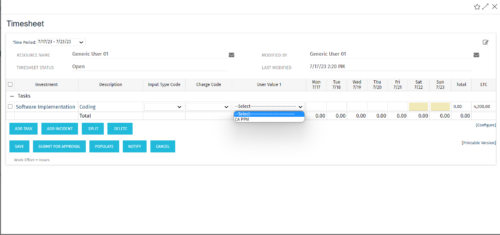 The tech-trick shows how to retrieve logged in User related values (ex: skill set) in timesheet.
 -
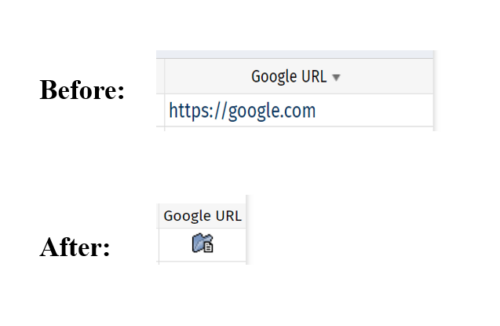 This tech-trick defines how a URL attribute can be changed to an image in a list view via CSS.
 -

 Pie Chart displays projects by Baseline Finish Variance—is current project finish beyond baseline finish; or is current project finish on or before baseline finish. Filterable by OBS structure and Finish Date range. Data labels show percent within baseline vs percent outside baseline. Mouse-over shows Within or Outside label and percent of total projects. Legend shows color coded Within Baseline and Outside Baseline labels. Drilldown: Clicking on a pie slice yields a grid portlet of projects either Within or Outside Baseline.
 -
Pie Chart displays projects by Baseline Finish Variance—is current project finish beyond baseline finish; or is current project finish on or before baseline finish. Filterable by OBS structure and Finish Date range. Data labels show percent within baseline vs percent outside baseline. Mouse-over shows Within or Outside label and percent of total projects. Legend shows color coded Within Baseline and Outside Baseline labels. Drilldown: Clicking on a pie slice yields a grid portlet of projects either Within or Outside Baseline.
-
Pie Chart displays projects by Baseline Finish Variance—is current project finish beyond baseline finish; or is current project finish on or before baseline finish. Filterable by OBS structure and Finish Date range. Data labels show percent within baseline vs percent outside baseline. Mouse-over shows Within or Outside label and percent of total projects. Legend shows color coded Within Baseline and Outside Baseline labels. Drilldown: Clicking on a pie slice yields a grid portlet of projects either Within or Outside Baseline.


Copyright 2023 • Rego Consulting Corporation • Privacy Policy