-
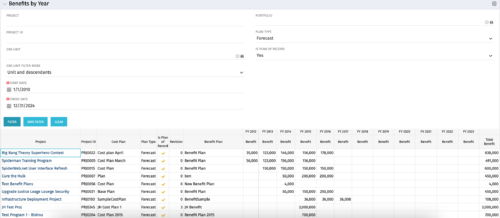 The Benefits by Year portlet summarizes Benefit totals by year and is searchable by Project, OBS and Portfolio. The results display both Budgeted Benefit Plans and Forecast Plans and the associated Cost Plan. Users can make use of this portlet to view Benefit Plan totals across an OBS or Portfolio or to compare the Budgeted Benefit of a Project versus the current plan.
 -
The Benefits by Year portlet summarizes Benefit totals by year and is searchable by Project, OBS and Portfolio. The results display both Budgeted Benefit Plans and Forecast Plans and the associated Cost Plan. Users can make use of this portlet to view Benefit Plan totals across an OBS or Portfolio or to compare the Budgeted Benefit of a Project versus the current plan.
-
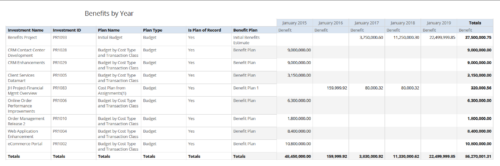 Benefits by year report provides the project manager a single place to view Benefit plan and its associated benefit for various years across multiple projects. Project Managers can use this report to analyze if the projects are giving intended benefits and take appropriate decisions accordingly. User can further narrow their search by OBS Type & Path, Investment Name, Investment Manager, Investment Type, Plan Type and Is Plan of Record?.
 -
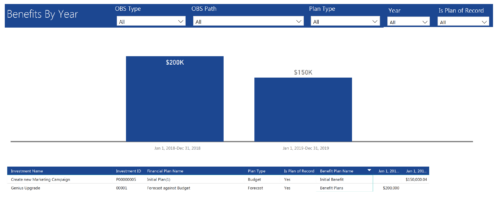 Benefits by year report provide the project manager a single place to view Benefit plan (Forecast /Budgeted) and its associated benefit for various years across multiple projects. Information is displayed in a bar graph and user can further drill down the details to investment level. Project Managers can use this report to analyze if the projects are giving intended benefits and take appropriate decisions accordingly. User can further narrow their search by OBS Type & Path, Plan Type (Budget/Forecast), Year and Is Plan of Record?.
 -
 Bar Chart displays average percent variance for all active projects by OBS unit. Percent variance = Planned Cost - Budgeted Cost / Budgeted Cost * 100. Projects with no Budgeted Cost are ignored for the calculation. Then all project variance percentages are algebraically added (some may be negative), and divided by total projects with a variance. This yields the Average Percent Variance. This calculation is performed for active projects in each OBS unit. OBS units include all units at all levels where projects are attached. Portlet filterable by OBS, Financial Status, and Financially Approved. Vertical axis = OBS Unit Name. Horizontal axis = Variance Percent. Data value = Average Percent Variance. Mouseover value = OBS Name + Average Variance Percent.
 -
Bar Chart displays average percent variance for all active projects by OBS unit. Percent variance = Planned Cost - Budgeted Cost / Budgeted Cost * 100. Projects with no Budgeted Cost are ignored for the calculation. Then all project variance percentages are algebraically added (some may be negative), and divided by total projects with a variance. This yields the Average Percent Variance. This calculation is performed for active projects in each OBS unit. OBS units include all units at all levels where projects are attached. Portlet filterable by OBS, Financial Status, and Financially Approved. Vertical axis = OBS Unit Name. Horizontal axis = Variance Percent. Data value = Average Percent Variance. Mouseover value = OBS Name + Average Variance Percent.
-
 This portlet shows the variance between the budgeted cost and the planned cost for projects. This allows for the variance to be displayed between what was planned and what was approved. This provides the PMs with the ability to better plan the costs.
 -
This portlet shows the variance between the budgeted cost and the planned cost for projects. This allows for the variance to be displayed between what was planned and what was approved. This provides the PMs with the ability to better plan the costs.
-
This portlet shows the variance between the budgeted cost and the planned cost for projects. This allows for the variance to be displayed between what was planned and what was approved. This provides the PMs with the ability to better plan the costs.
-
This course will provide an overview of CA PPM Demand Management functionality. Topics include: - What is Demand Management?
- Accessing and Creating Ideas
- Staffing the Idea Team
- Creating and Approving Idea Financial Plans
- Idea Conversion to another Investment Type
- Accessing and Creating Incidents
- Adding Incident Tasks to a Project
-
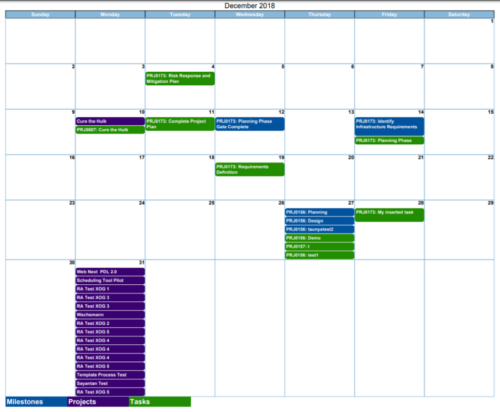
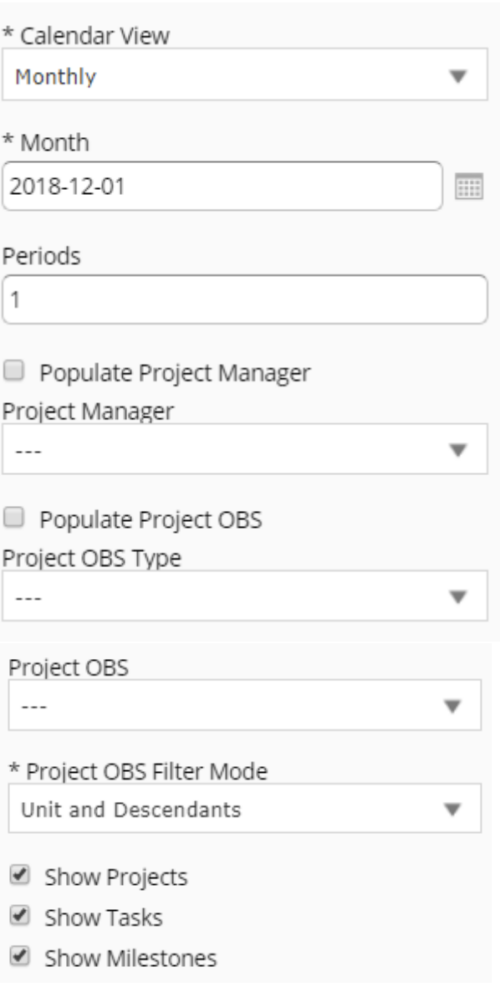 Calendar View report provides a view of Projects, Milestones or Tasks that has finish date within the user selected month. User has the flexibility to choose to Calendar view as Monthly or Weekly and also number of periods that needs to be displayed in the report. Report can be filtered to show only Projects or Milestones or Tasks with the checkboxes provided. It can also be further filtered using Project Manager and Project OBS parameters.


Copyright 2023 • Rego Consulting Corporation • Privacy Policy