
- is a weekly email to a project manager. All of the content will be for where the person getting the email is the PM
- shows aggregate data for all of their projects
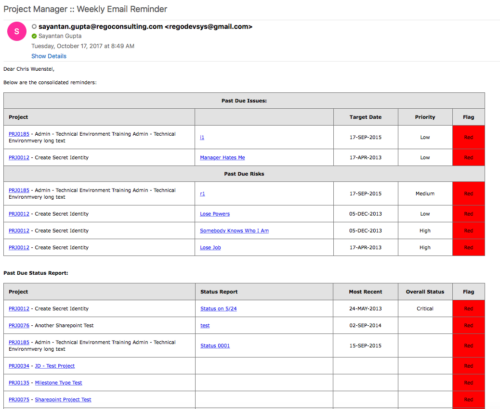
- sends the PM a reminder email at the end of each week showing the items that the PM needs to do. Maybe call it Weekly PM reminder.
- Shows the mentioned data in sections as follows:
- Past Due issues
- Only active projects
- Only open issues – not resolved or closed
- Show project name, project ID, issue name, issue priority, target resolution date, color (only red or yellow)
- Logic for Yellow = where target resolution is within the next week
- Logic for Red = target resolution date is in the past
- URL LINK: to that issue
- Past Due Risks
- Only active projects
- Only open risks – not resolved or closed
- Show project name, project ID, risk name, risk priority, target resolution date, color (only red or yellow)
- Logic for Yellow = where target resolution is within the next week
- Logic for Red = target resolution date is in the past
- URL LINK: to that risk
- Past Due Status Report
- Only active projects
- Show project name, project ID, report date, most recent overall status, color (only red or yellow)
- Only 1 line per project – show even if there is no status report
- Logic for Yellow = where latest status report date > 7 days ago
- Logic for Red = latest status report date is > 14 days ago
- URL LINK: to status report list
- Past Due Milestones
- Only active projects
- Only open milestones
- Show project name, project ID, task name, task finish date, color (only red or yellow)
- Logic for Yellow = where finish is within the next week
- Logic for Red = finish date is in the past
- URL LINK: to that milestone
- Past Due Forecast
- Only active projects
- Show project name, project ID, last updated date, most recent total plan of record amount, color (only red or yellow)
- Only 1 line per project – show even if there is no finish plan
- Logic for Yellow = where last updated date of the plan of record > 14 days ago
- Logic for Red = where last updated date of the plan of record > 30 days ago
- URL LINK: to cost plan
- Allocation Summary for the Project Team
- Past Due issues
- Unfilled Roles that need to be staffed
- Resources Actuals +/- 25% of Allocation
- Resource ETC +/- 25% of Allocation
- Pending Change Controls / Approval Status
- In addition to the Past Due Milestones, upcoming milestones
- Budget Summary
- Actual vs. Planned
- Burndown estimate
-
 A process that:
 -
A process that:
- is a weekly email to a project manager. All of the content will be for where the person getting the email is the PM
- shows aggregate data for all of their projects
- sends the PM a reminder email at the end of each week showing the items that the PM needs to do. Maybe call it Weekly PM reminder.
- Shows the mentioned data in sections as follows:
- Past Due issues
- Only active projects
- Only open issues – not resolved or closed
- Show project name, project ID, issue name, issue priority, target resolution date, color (only red or yellow)
- Logic for Yellow = where target resolution is within the next week
- Logic for Red = target resolution date is in the past
- URL LINK: to that issue
- Past Due Risks
- Only active projects
- Only open risks – not resolved or closed
- Show project name, project ID, risk name, risk priority, target resolution date, color (only red or yellow)
- Logic for Yellow = where target resolution is within the next week
- Logic for Red = target resolution date is in the past
- URL LINK: to that risk
- Past Due Status Report
- Only active projects
- Show project name, project ID, report date, most recent overall status, color (only red or yellow)
- Only 1 line per project – show even if there is no status report
- Logic for Yellow = where latest status report date > 7 days ago
- Logic for Red = latest status report date is > 14 days ago
- URL LINK: to status report list
- Past Due Milestones
- Only active projects
- Only open milestones
- Show project name, project ID, task name, task finish date, color (only red or yellow)
- Logic for Yellow = where finish is within the next week
- Logic for Red = finish date is in the past
- URL LINK: to that milestone
- Past Due Forecast
- Only active projects
- Show project name, project ID, last updated date, most recent total plan of record amount, color (only red or yellow)
- Only 1 line per project – show even if there is no finish plan
- Logic for Yellow = where last updated date of the plan of record > 14 days ago
- Logic for Red = where last updated date of the plan of record > 30 days ago
- URL LINK: to cost plan
- Allocation Summary for the Project Team
- Past Due issues
- Unfilled Roles that need to be staffed
- Resources Actuals +/- 25% of Allocation
- Resource ETC +/- 25% of Allocation
- Pending Change Controls / Approval Status
- In addition to the Past Due Milestones, upcoming milestones
- Budget Summary
- Actual vs. Planned
- Burndown estimate
-

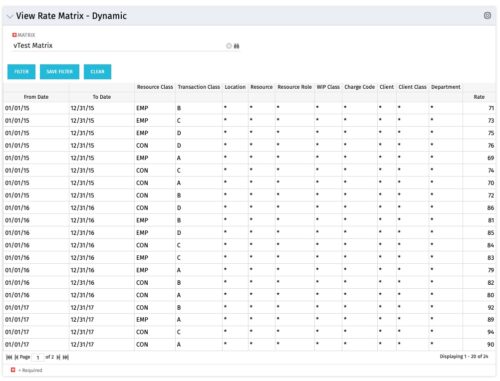 View Rate Matrix is a grid portlet that provides users a single place to view all the rates defined across multiple rate matrix without going to administration tab. Each Matrix may be defined with different columns (ex: Charge Code, Client, Department, Entity, Input type Code etc). This portlet dynamically brings only the columns associated with that rate matrix and provides the detailed information. User can view information related to one matrix at a time.
 -
View Rate Matrix is a grid portlet that provides users a single place to view all the rates defined across multiple rate matrix without going to administration tab. Each Matrix may be defined with different columns (ex: Charge Code, Client, Department, Entity, Input type Code etc). This portlet dynamically brings only the columns associated with that rate matrix and provides the detailed information. User can view information related to one matrix at a time.
-
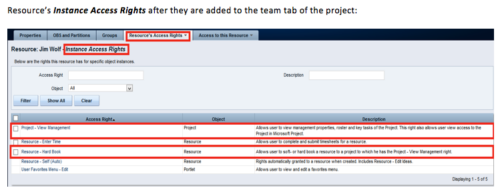 When a team member is added to the Team tab of the project, this process will add Project - View Management and Resource – Hard Book instance access right to the team member’s profile. This allows the team member to add their own allocations. NOTE: The process is NOT auto-start, and hence, needs to be run manually from Home > Organizer > Processes > Available
 -
When a team member is added to the Team tab of the project, this process will add Project - View Management and Resource – Hard Book instance access right to the team member’s profile. This allows the team member to add their own allocations. NOTE: The process is NOT auto-start, and hence, needs to be run manually from Home > Organizer > Processes > Available
-
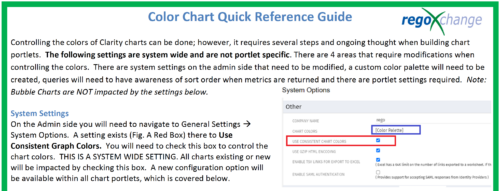 The Using Consistent Colors technical trick shows how management can create a uniform color pallet for all charts within the system. This trick, not only makes charts more professional when delivering to management, but also creates a uniform pattern throughout the Clarity environment.
 -
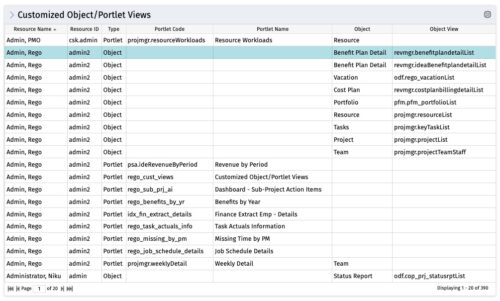 The Customized Object/Portlet Views portlet displays all user edited object/portlet views and the resource(s) that have edited them. This can assist in identifying users who need to be notified prior to publishing view changes. The table below describes the available columns on the object.
Column Label Description Resource Name Name of the resource Resource ID ID of the resource Type Object or Portlet Portlet Code ID of the portlet Portlet Name Name of the portlet Object Associated Object Object View ID of the modified view on the object Object Code Internal code used by the query pkid Internal code used by the query portlet_dbid Database id of the portlet res_dbid Database id of the resource -
The Customized Object/Portlet Views portlet displays all user edited object/portlet views and the resource(s) that have edited them. This can assist in identifying users who need to be notified prior to publishing view changes. The table below describes the available columns on the object.
Column Label Description Resource Name Name of the resource Resource ID ID of the resource Type Object or Portlet Portlet Code ID of the portlet Portlet Name Name of the portlet Object Associated Object Object View ID of the modified view on the object Object Code Internal code used by the query pkid Internal code used by the query portlet_dbid Database id of the portlet res_dbid Database id of the resource -
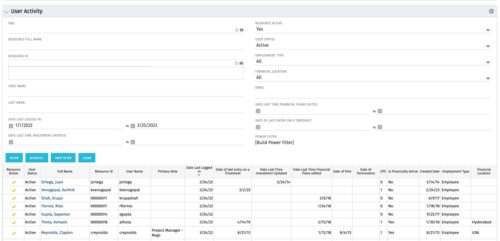 The User Activity portlet is in essence an expansion of the out of the box User List by License Type portlet, which only display the Last Logged In date of resources. This portlet offers several additional fields to help admins dig deeper into user activity within the tool. The table below describes the available filter fields for the portlet.
Column Label Description OBS OBS the resource(s) belong to Resource Full Name Resource’s First and Last Name Resource ID Resource’s ID First Name Resource’s First Name Last Name Resource’s Last Name Date Last Logged In Date the Resource last logged in Date Last Time Investment Updated Date the Resource last made an Investment update Resource Active The Resource’s active status Employment Type Resource’s Employment Type Financial Location Resource’s Financial Location Email Resource’s Email Address Date Last Time Financial Plans Edited Date the Resource last made a Financial Plan edit Date of last entry on a Timesheet Date the Resource last made an entry on a timesheet Created Date Date the resource was added to the system Date of Hire Resource’s Date of Hire Date of Termination Resource’s Date of Termination Financial Department Resource’s Financial Department Home Page Resource’s Home Page Language Default Language of the Resource Primary role Resource’s Primary Role Resource manager Resource’s Manager Track Mode Resource’s Track Mode User Name Resource’s Username
