-
 A presentation by the Broadcom leadership on the meaning of ValueOps and the future of Clarity and Rally.
 -
 By its very nature, the shift to Product Funding is going to require that tracking of that funding. Agile tools do not have much, if any, financial capabilities, so it is important to create an eco-system that can support this value stream—from funding, through delivery, and finally to tracking the realization of financial value. Learn how Rally and Clarity PPM do this very well together.
 -
 This training document is a Rego Consulting Quick Reference Guide to assist with the adding of resources to the Staff tab for Ideas in Clarity’s Modern User Experience. This doc references version 16.1 views. Document provides detail on how to add resources to the Staff tab, Default Allocation % and Per-Period metrics.
 -
 This training document is a Rego Consulting Quick Reference Guide to assist with Idea approval and conversion to projects in Clarity’s Modern User Experience. This doc references version 16.1 views. Doc reviews setting Ideas as Approved and converting Ideas to projects.
 -
 This training document is a Rego Consulting Quick Reference Guide to assist resource managers with the adjusting of timesheets. This doc references version 16.1 views. Document provides guidance on how to use the Review & Approve tab to adjust time that has already been entered by a resource.
 -
 A presentation slide deck from Rego University 2022. This course reviewed the advantages of using REST APIs in Clarity development.
- Overview
- Why REST now?
- Clarity Rest Endpoints
- Create Project with java.net.URL
- Create Task with HttpClient
- Update Project with java.net.URL
- Update task with HttpClient
- Create Task with RestApiJavaClient
- External REST Endpoints
- Connect with java.net.url
- Connect with Apache Commons HTTP/S Client
- Additional Tools
- Overview
-
 A presentation slide deck from Rego University 2022. This document is an outline used in class for use of GEL Scripts in Clarity Development.
- Introduction
- Configuration Basics
- Security Basics
- Installing Jaspersoft Studio
- Interface Introduction
- Data Adapter Setup
- Server Connection Setup
-
 A presentation slide deck from Rego University 2022. This document reviews the discussion around AI and the more realistic option of Predictive Modeling that exists in the near future of PPM. Then the group worked on ideas to bring to PPM tools via PM.
- Predictive Modeling / AI Trend
- Why are we here? Goals for this session
- Creativity Workshop - Brainstorming
- Summary of Themes
- Qualify top Themes
-
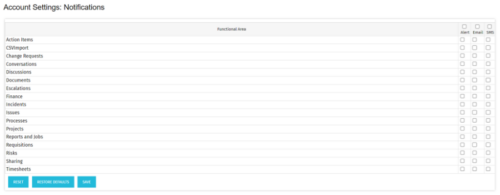 The Turn off Notifications process disables all Email, SMS and Alerts notifications for all users. This process is helpful if users would not like to receive emails from the system regarding actions items, timesheet submissions, etc. The script may be modified to include all users or all users that have been created within the last day.
 -
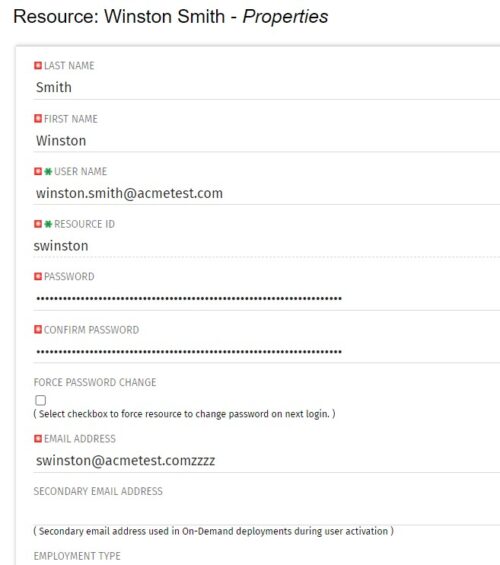 The Update Email Ids workflow sets all users’ email addresses to non-working by appending a “ZZZZ” to the end of the email address. This process is used for when there are refreshes to your Development or Testing environments and do not want emails going to users. When complete, the log will display the total amount of email addresses updated. A second process is included in this workflow that will revert the email addresses to remove the “ZZZZ” added in the first workflow. In some instances, the process may be run in error, or you may want to send emails from a Development or Testing environment; using this second process you will be able to enable all emails again.
 -
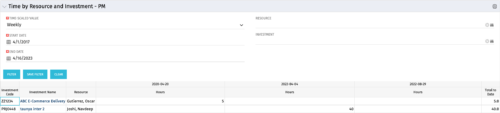 The Time By Resource and Investment - PM portlet shows time spent on projects where the logged in user is the project manager. This portlet is used to get a snapshot of investments and the time that has been put against them at the individual resource level for the projects that user has access to. This portlet is used for determining what resources have put time against specific investments and can be used to see where resources are spending their time or to help rationalize ETCs for remaining work for planning purposes. The portlet may be filtered by time-scale, date, resource or investment to narrow the search results.
 -
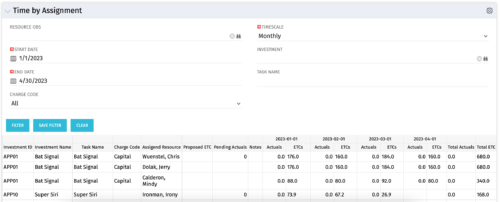 The Time by Assignment portlet displays time logged to assignments for all investments the logged in user has security rights to view - pulling data from the timeslices. It is capable of displaying the data by weekly, monthly or quarterly segments. The portlet may also be filtered by investment and resource OBS.


Copyright 2023 • Rego Consulting Corporation • Privacy Policy