-
 This portlet shows the variance between the budgeted cost and the planned cost for projects. This allows for the variance to be displayed between what was planned and what was approved. This provides the PMs with the ability to better plan the costs.
 -
 The portlet shows the Overall Status and Budget Status and Amounts. It displays one row per project. The portlet shows the following main fields: Overall Status, Budget Status, Capital Budget, Operating Budget, Total Budget, Capital Planed, Operating Planned, Total Planned, Capital Actuals, Operating Actuals, Total Actuals, Budget Variance ($), Budget Variance (%) Displaying the budget variance allows the PM to understand of the project is over / under spent, and thus the costs planning needs to be re-visited.
 -
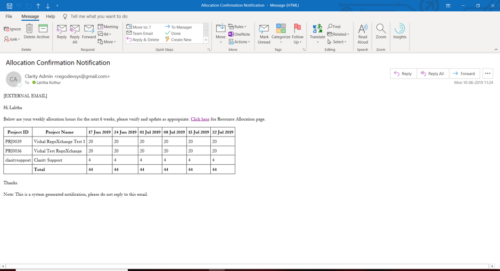 A Process run via Execute a Process job; sends an email to active resources, containing a facsimile of their Resource Allocation Detail page. It shows the next six weeks of allocations by investment, with a column total. The email also contains a click here link to this page in CA PPM, to enable editing of the data, as appropriate.
 -
 Part of the Business Transformation collection, this line chart portlet displays realized vs planned benefits overtime, for portfolio investments. This provides the PfM with a holistic view of benefits planned vs realized over a period of time.
 -
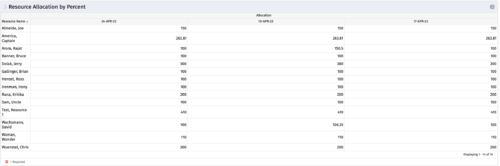 This portlet shows resource allocation by percent and hours, and gives ability to filter on allocation percent. The RM can use the portlet to see if any of the resources is over/ under allocated.
 -
 The Investment Resource Rate portlet allows a user to search for effective (or missing) rates for resources across all investment types. It pulls rate information from the matrix extraction tables and includes currency conversion if the environment supports multiple currencies. The portlet can be used both to search for the rate of any given resource and to determine which resources might be missing rates when an error is generated when attempting to populate a cost plan (REVMGR-20728:Rates and Costs are both missing for one or more roles/resources).
 -
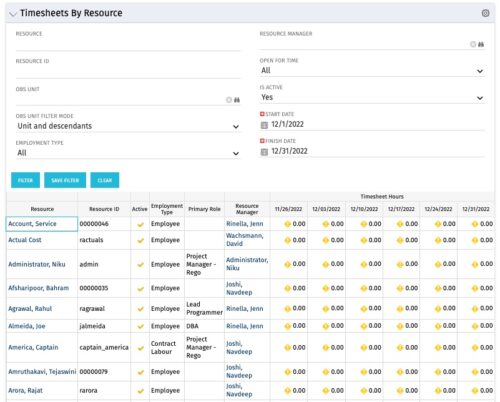 The Timesheets by Resource portlet gives the ability to highlight the time periods where resources are working overtime or working less than 25 hours a week. The filter requires timesheet Start Date and End Date to be provided. Additionally, the information can be filtered by Resource, Resource ID, OBS Unit, Employment Type, Resource Manager, Open for Time, and Active status. This portlet displays Resource, Resource ID, Active (yes/no), Employment Type, Primary Role, Resource Manager, and Timesheet Hours Flag. The flags are set with the logic
- Yellow = timesheets not posted / zero hour timesheets
- Green = where number of hours posted is > 25 and less than 45
- Red = where number of hours posted is < 25 or > 45
-
The Timesheets by Resource portlet gives the ability to highlight the time periods where resources are working overtime or working less than 25 hours a week. The filter requires timesheet Start Date and End Date to be provided. Additionally, the information can be filtered by Resource, Resource ID, OBS Unit, Employment Type, Resource Manager, Open for Time, and Active status. This portlet displays Resource, Resource ID, Active (yes/no), Employment Type, Primary Role, Resource Manager, and Timesheet Hours Flag. The flags are set with the logic
- Yellow = timesheets not posted / zero hour timesheets
- Green = where number of hours posted is > 25 and less than 45
- Red = where number of hours posted is < 25 or > 45
-
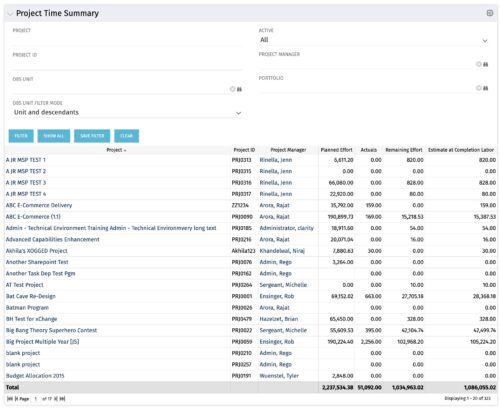 Project managers may use this portlet to show the planned effort and the remaining effort on projects. Includes actual hours as well as estimate at completion. You may narrow the results by filtering by project name, project manager, project OBS, or active flag. The portlet will display each project by ID, name, project manager, planned effort (total allocation hours), actual hours, remaining effort (ETC), and estimate at complete (actual + ETC).
 -
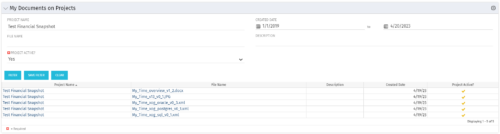 The My Documents on Projects portlet displays all of the documents the user has uploaded to projects. This portlet provides the user a single place to view documents across multiple projects without having to go into each project individually. This is efficient and time saving for the user. The filter allows the user to narrow their search by Project, File Name, Active Projects and Description. You may also narrow the view to display documents with a created date within a certain date range. Note: In v13, clicking the file name will link to the collaboration tab where the document resides.
 -
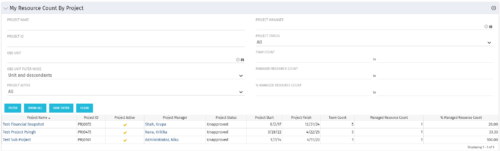 The My Resource Count by Project portlet displays project information, total team count and the current user’s resource count assigned to each project. The user may narrow the results by filtering on project name, manager, status, team count, managed resource count or percentage managed resource count. Using this portlet, resource managers can quickly identify which projects their resources are allocated to without having to navigate to each resource individually. Not only does this portlet display the overall team count on the project (team count), but it also displays the managed resource count (logged in user’s number of resources allocated to the project) as well as the percentage of managed resource count to team count.
 -
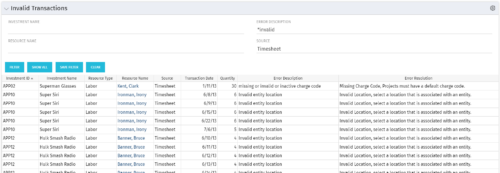 The Invalid Transactions portlet displays all of the transactions that did/will not post in Clarity. The benefit of this portlet is that you can use the filter to select a specific project, resource, or error to display all transactions associated to your selection. There are several reasons a transaction may fail to post such as inactive resource, no location or inactive location selected on the Financial sub-page, project on hold, etc. To resolve the error, the user must go into the project or resource and make the noted change. Once all corrections are complete, the Post Transactions to Financials job must be run to evaluate the corrected WIP transactions to be sure the data is now complete and accurate. If additional incorrect data is found, the transaction will fail to post again and the new error/reason will display.


Copyright 2023 • Rego Consulting Corporation • Privacy Policy