
- Introduction to scheduling
- Why use an external scheduler?
- Who uses what?
- Scheduler-Specific Decision Factors
- Discussion: Scheduler Challenges
- Tips to help user adoption
- Is it time to just use Clarity?
- Microsoft Project OOTB or The Rego Connector?
-
 A presentation slide deck from Rego University 2022. This document reviews the options for managing schedules outside of the Clarity tool.
 -
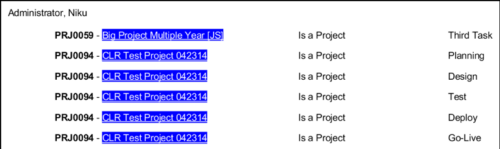 In Jaspersoft Studio, Static Text and Text Fields can display text with markup instead of plain text. This allows a wide variety of customization to how the text is displayed. This Tech Trick provides Instructions on how to use this feature of Jaspersoft Studio.
 -
 How do I mature my portfolio planning? What is my organization's next steps in maturing our portfolio planning processes, and how can CA PPM or other tools help? This class will review industry trends related to portfolio planning and talk about what each organization should aspire to portfolio processes.
 -
 A presentation slide deck from Rego University 2022. This course was a review of the power of perception and how to improve on the adoption of Apptio.
- The Perception of Apptio
- The Perception of Adoption
- Driving Adoption
- Measuring Success
-
 Are you struggling with Apptio user engagement and adoption? Do you struggle to get stakeholders to provide data or executives to log in to Apptio? If you've spent time, energy, and funding to develop a great TBM program but are not seeing the engagement you want, this session is for you. We will show you how to drive Apptio adoption and improve stakeholder engagement.
 -
 Have you ever experienced the downside of metrics? This class is a working session that review different types of metrics and the problems they uncover as well as the problems they can cause. Learn how to balance your positive and negative metric impacts.
 -
 Looking for metrics that you can implement immediately in CA PPM? This class will be a working session to review all of the content available out of the box and within the CA and Rego content packs. This will provide you the options for metrics the represent industry best practice without the costs to develop them.
 -
 See how multiple Rego innovations can save time, reduce effort, and increase adoption across your organization. Leverage Power Automate to connect Clarity with SharePoint, Teams, and Outlook—automating tasks like creating Teams for projects, managing permissions, and sharing reports with non-Clarity users. Discover how the RegoLink PowerPoint add-in keeps decks up to date with templates and live Clarity data, and how the Excel Data Manager (EDM) simplifies bulk updates by letting you edit and validate data in Excel before syncing back.
 -
 A presentation slide deck from Rego University 2022. This document reviews the reasons for and the steps to migrate to Clarity’s Modern User Experience.
- Introduction
- Why?
- Migration Strategies
- Planning the Pilot
- Tactical Checklist
-
 Are you still using Clarity's classic User Experience? Are you getting behind on leveraging Modern UX capabilities? This class will be a practical guide on how to move your users to the Modern UX. We will discuss real use cases and help provide guidance on this strategic decision. We also plan to have a portion of the class dedicated to Q&A with customers that have already migrated.
 -
 Are you still using all classic UX? Are you wondering how and when you should transition to the new UX? This class will be a practical guide on how to know what to move and when to move. We will discuss real use cases and help provide guidance on this strategic decision.
 -
 Are you still using the classic User Experience? Are you wondering how and when you should transition to the ModernUX? This class will be a practical guide on how to move your users to the ModernUX. We will discuss real use cases and help provide guidance on this strategic decision. We also plan to have a portion of the class that is Q&A from customers that have moved.
