-
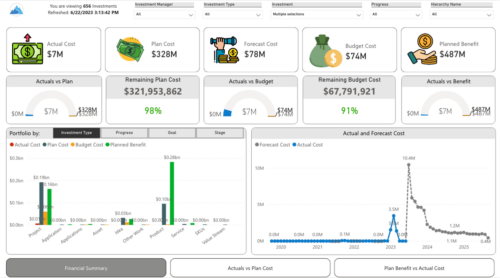
 Gain a financial view of your investments by comparing actuals to planned cost and planned benefit. Report views include: • Financial Summary • Planned Benefit vs Actual Cost • Actuals vs Planned Costs Demo Video - https://www.youtube.com/watch?v=uyDSbbgG1O8&list=PLXJ5ktuWV0jiS9CvBpHvBIwpKPmA9uvwK&index=2
 -
 The portlet is a browser XOG client in the form of an HTML portlet. The purpose is to read/write data from/to Clarity. To write the data, the user needs to have Project – Approve OR Project - Approve - All access right.
 -
 This training document is a Rego Consulting Quick Reference Guide to assist with the process of creating financial actuals and the supporting reports in Clarity’s Modern User Experience. The document covers running jobs to sync data, analyzing cost plans, reviewing transactions, and analyzing cost and budget plans.
 -
 The Financial Summary by Transaction Class provides a visual graph for each year’s financial picture for multiple years. Report contains the following items: KPIs: Displays total benefit, capital, expense and net cash flow for the selected filter criteria Grid: Displays year wise break up of benefit, capital, expense and net cash flow for the selected filter criteria Graph: Benefit, capital, expense and net cash flow are depicted in graphical way for multiple years. This report will show the user where they need to concentrate their efforts in order to meet financial commitments. User can further narrow their search by OBS Type & Path.
 -
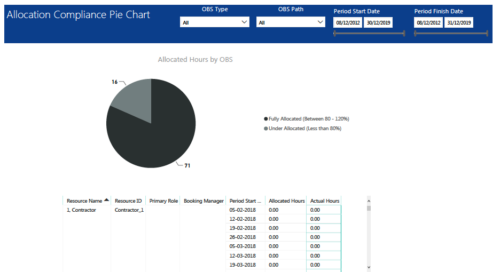 Allocation Compliance Pie Chart report provides resource managers a single place to view Allocation compliance for various resources. It displays the following: Allocated Hours by OBS chart: Pie chart that displays percentage of resources that are fully allocated (80 -120 %) and under allocated (less than 80%) for a particular OBS and selected period range. Grid: Displays Resource Name, Resource Id, Primary Role, Booking Manager, Period, Allocated hours and Actual hours during that period. You can further narrow your search by OBS Type, OBS Path & Period Date range.
 -
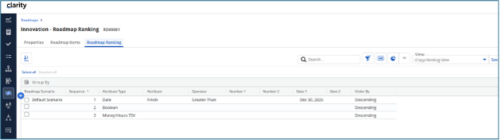
 The Rego Roadmap Ranking provides the ability to rank Roadmap Items within individual Roadmap Scenarios. The function allows the user to define a hierarchical sequence to defined attributes to create a set of rules to generate an auto-ranking, by scenario. Large sets of ranking rules increase complexity and variability, so choose initial rules carefully. When the rank order is configured, a process is actioned that auto-ranks the Roadmap Items for the selected Roadmap Scenario. The Roadmap Ranking can be viewed through the Timeline, Board, or Grid View.
 -
This training document is a Rego Consulting Quick Reference Guide to assist with utilization of the Staffing page in Clarity’s Modern User Experience. This doc references version 16.2.1 views. Document provides detail on the layout and capabilities of the Staff Grid as well as the Allocations Timeline. Information is provided on columns, widgets and filtering. Instructions are provided on how to save Views. Summary information is provided on the layout of the Allocation Timeline and includes detail on the Investment Timeline and the Resource Histogram. Investment Timeline summary contains information on the Allocations by Investments and the Allocations by Resources tabs. While the Resource Histogram section provides screenshots on Resource Availability and Resources by Role.
-
 Do you want to understand the OOTB configuration and functionality of financial management? In this class, we will review the OOTB objects, views, views, and functions of financial plans, rates, and other related areas. We will cover both newUX gaps from classic. We will discuss best practices.
 -
 This session will aligning you with some of the best and most common practices for using Clarity's Project Management capabilities. Come and learn about the capabilities that come out of the box for excellent project management. Things like objects, views, financial plans and general project management capabilities will be covered. Additionally, tips and tricks will be discussed leaving you with a toolkit of ideas.
 -
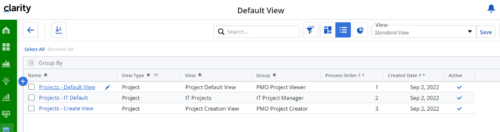
Manage default views for new users based on security groups or publish a view to all users in a specified security group. For more details, please refer to the detailed documentation.
-
 A Quck Reference Guide to assist in the application of Field Level Security for Groups in Clarity’s Modern UX. Reviews the process of applying security to specific fields for specific groups.


Copyright 2023 • Rego Consulting Corporation • Privacy Policy