-
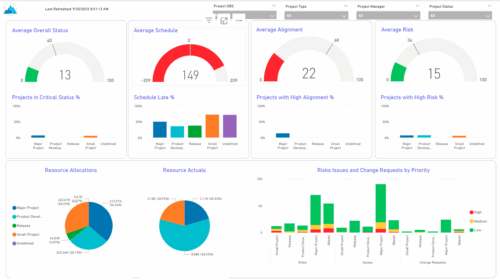 The KPIs by Project Type (Dashboard) report provides visibility into key project health measures, including status, schedule, alignment, and risk. Gauge visuals highlight each KPI at a summary level, while column charts break down results by project type. Resource allocation and actual hours are summarized in pie charts, making it easy to compare utilization across project types. In addition, bar charts display the number of issues, risks, and change requests by project type and priority, helping teams quickly identify areas of concern.
 -
 Discover Rego's integration tools that are specifically built to help develop and standardize the integration process. Learn about Rego's Data Extractor - a highly configurable and efficient tool to extract Clarity data into flat files. And also Rego's Data Processor - a highly configurable tool that abstracts the most common development tasks for an inbound integration. We'll review both tools and discuss integration best practices.
 -
 This beginner-friendly course provides an introduction to navigating the application. We'll cover grids, filters, views, and account settings.
 -
 This round table discussion will focus on Clarity configurations using Studio. A well-configured Clarity environment will minimize performance bottlenecks, ease development, and increase end user adoption. Join us to discuss best practices around object structure, naming conventions, audit trail settings, and more.
 -
 Aligning work to organizational strategy is a fundamental requirement in today's ever-changing marketplace. High performing organizations are moving beyond basic connections to introduce strategic hierarchies that are tied to real measurements of business value via Clarity's Objectives and Key Results (OKRs). Join our expert guides as they present key concepts, best practices, and the evolution of strategic alignment.
 -
 Prosci presents an AI Adoption Workshop with a focus on getting a ROI on your investment in AI.
 -
 What if you could see tomorrow’s challenges and opportunities before they happen? Join us for an exclusive demo of new Predictive Analytics features for Clarity. You'll discover how predictive insights can deliver early warnings, risk signals, and actionable recommendations—empowering you to move from reactive firefighting to proactive decision-making.
 -
 Want to boost Clarity adoption and data quality, all while having fun and keeping users engaged? Learn how gamification can benefit your organization in this exclusive demo. Check out features that reward users for desired behaviors, enable personalization, and offer fun ways to track project health through the animated world of Planimals.
 -
 The need to report and organize work around the Products continues to grow. Join this session to hear how Project and Product Management can thrive together in Clarity.
 -
 Do you want to talk to other Clarity customers that are using - or plan to use - demand management capabilities? In this moderated Roundtable, attendees can share experiences and provide insights on process, configurations, challenges, and successes. We will have an expert panel and then divide into small groups to discuss customer selected topics. 100% sharing. 100% learning.
 -
 The Project Risk Register report provides visibility into project risks, including detailed information on each risk and its associated items such as notes, action items, tasks, and related risks or issues. Results can be grouped by project or viewed without grouping to support flexible analysis. Interactive visuals make it easy to track, monitor, and manage risks across projects.
 -
 Hear from existing Clarity customers as they share what's working well in their implementations. Gain insights from these real-world success stories. This deck is from Day 1 of the Client Presentations.


Copyright 2023 • Rego Consulting Corporation • Privacy Policy