-
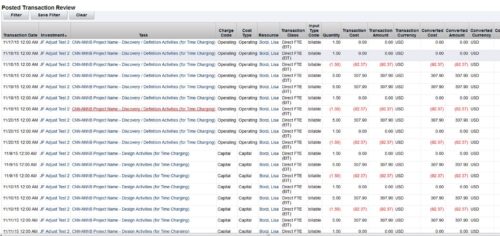 This is an automation to adjust the cost in financials (WIP) based on the standard weekly hours for salaried (Exempt) personnel. The process adjusts only the cost in WIP where the hours per week that are posted for a resource are more than the standard work week. The Posted hours in the timesheet and in WIP remain untouched. For the process to calculate correctly, all time in a given week needs to be accounted for, including all non-project time. The process has three input parameters as explained below:
- wkStdHour: Standard Weekly Hours; this can be changed in the process gel script. The parameter is based on the organization standard work week. The default is set to 40 hours.
- xogBatchSize: The XOG batch size. This is used to upload data in batches to avoid high memory and performance issues. The default batch size is set to 50 records.
- username: The resource name that the process uses for uploading data. The default is set to admin.
- It will process all the timesheets in posted state provided the timesheet has not been adjusted earlier by this process and there are no pending transactions to be posted for it. Validation is made based on Notes field, which is populated once adjustment is done by the process.
- Notes field should not be modified in Script nor should be worked upon by any other process.
- All the invalid transactions should be cleared and post to WIP should be finished with no pending records.
-
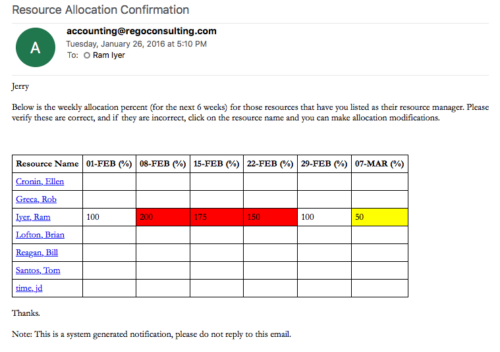
 Based on the pre-determined schedule frequency, this job will send an email to Resource Managers that have a Resource meeting the criteria of: Average allocations are less than 100% where Resource(s) and Project(s) are active over the next two weeks. This serves as a reminder to Resource Managers to monitor and manage allocations. The contents of the email include a message indicating the Resource Manager has at least one Resource meeting this criteria and a table indicating the Resource and that resource’s average, next 90 days allocations.
 -
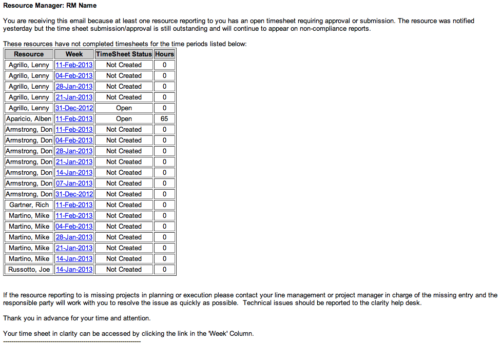 The Time Tracking Stalker - RM workflow process automatically sends an email to Resource Managers for each one of their resources that have not submitted their timesheet for a prior open time period, thus informing the RM if their resources are submitting their timesheets on time. Project Managers will also benefit since the notifications will help to ensure that time is being posted against their projects in a timely manner, helping to provide them with an accurate view of time expended on the projects.
 -
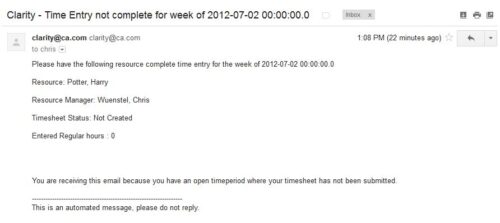 The Time Tracking Stalker – Resource workflow process is used to notify resources that fail to submit a timesheet in a prior week. The workflow checks for active resources, hire/termination dates, track mode, and open for time entry. This process helps to ensure resources submit timesheets in a timely manner. In version 13, the email can be enhanced to include colors, bold, underline, and other HTML formatting.
 -
 The Grant Project Edit Rights workflow process allows a project manager to grant project edit rights to another user without contacting an administrator. The workflow uses the Out-of-the-box field for Business Owner. The script starts when the field is updated. It will assign project edit rights to whichever user is added to the Business Owner field. This process can be modified to grant project edit rights to any user within a project field.
 -
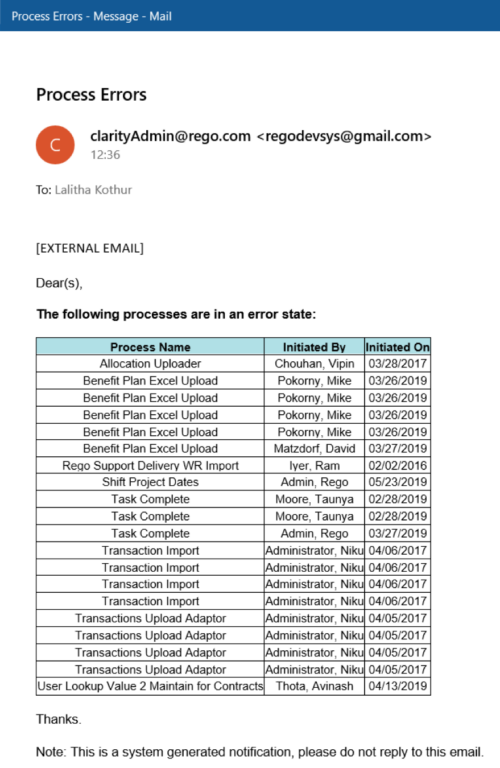 The Email Process Instance Errors workflow process will email a selected group within Clarity informing them of process errors that are currently in the system. The selected group is input through a gel parameter so it may be easily changed. This workflow helps to resolve errors quickly by emailing group members of the errors within the system so they may take action immediately.
 -
 Do you want to know more about building outbound integrations using a flat file placed on an SFTP Server? Does your organization have an external BI tool like Cognos, Tableau, Domo, or Qlikview? This session will review strategies for getting data into your corporate BI tools. We will also show Rego's data extraction tool and how it can be used for all outbound file-based integrations to save money and time.
 -
 How do I mature my portfolio planning? What is my organization's next steps in maturing our portfolio planning processes, and how can CA PPM or other tools help? This class will review industry trends related to portfolio planning and talk about what each organization should aspire to portfolio processes.
 -
 Course Description: We once had a client refer to the reports they developed as “Fisher-Price” reports. Reports should be built with consistency using graphic design principles. Join a Rego architect and UX designer to learn some fundamental graphic design principles such as grid theory, ink-to-data ratio, flow, balance, and more. Come prepared to be "wowed."

