-
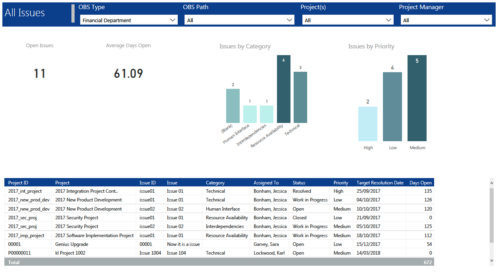 All Issues report provides project managers a single place to view KPIs related to Issues. All the KPIs are depicted in various visualizations. Open Issues: Scorecard that displays the # of Issues that are not closed or resolved. Average Days Open: Scorecard that displays the # of days on an average an issue is in open state. Issue category: Column chart that displays # of Issues by category. X axis displays various Issue categories. Data labels indicate the number of Issues associated with that category. Issue Priority: Column chart that displays # of Issues by priority. X axis displays various Issue priority. Data labels indicate the number of Issues associated with that priority. Grid: Displays Issue details such as Project ID, Project, Issue ID, Issue, Category, Assigned To, Status, Priority, Target Resolution Date and Days Open. You can further narrow your search by OBS Type, OBS Path, Project(s) and Project Manager.
 -
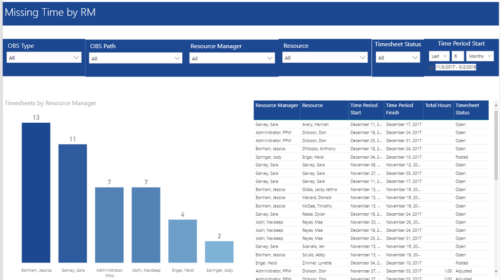 Missing Time by RM report displays Resources whose timesheets are missed by Resource Manager. There is Clustered Column Chart which displays missed timesheets count by Resource Manager. Also, there is table view of Resource Manager, Resource, Time Period Start and Finish Dates, Total Hours and Timesheet status. User can narrow their search by OBS Type & Path, Resource Manager, Resource, Timesheet Status and Time Period Start Date (Relative or Specific Date Range).
 -

A presentation slide deck from Rego University 2022. This document reviews the best practices for resource management in Clarity. - Implementation
- Availability
- Allocation
- Assignment
- Reporting
- Notification
- Data Maintenance
-
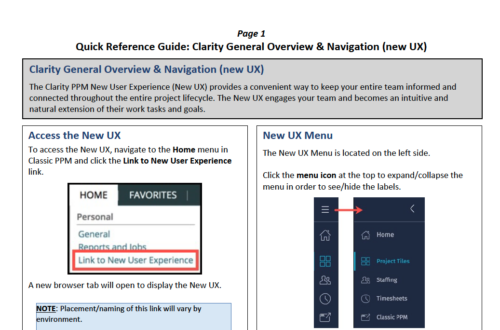 The Clarity PPM New User Experience (New UX) provides a convenient way to keep your entire team informed and connected throughout the entire project lifecycle. The New UX engages your team and becomes an intuitive and natural extension of their work tasks and goals.
 -
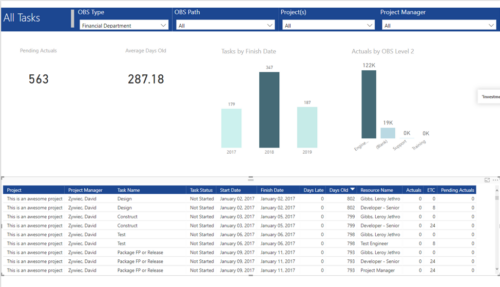 All Tasks report provides project managers a single place to view KPIs related to Tasks. All the KPIs are depicted in various visualizations. Pending Actuals: Scorecard that displays the # of Actuals that are still open and not yet posted. Average Days Old: Scorecard that displays the average number of Task Days Old. Days Old is the difference between Task Finish date and Today’s Date (when Today’s Date > Task Finish date. In other cases, it is zero) Tasks by Finish Date: Column chart that displays # of Tasks by Year of Finish date. X axis display Calendar years. Data labels indicate the number of Tasks finish date within that year. Actuals by OBS level 2: Column chart that displays sum of Task Actuals by OBS level 2. X axis display OBS level2. Data labels indicate the Actuals within that OBS level2. Grid: Displays Risk details such as Project Name, Project Manager, Task Name, Task Status, Start Date, Finish Date, Days Late, Days Old, Actuals, ETC and Pending Actuals Days Late is the difference between Task Finish date and Baseline Finish Date (when Baseline Finish Date > Task Finish date. In other cases, it is zero) You can further narrow your search by OBS Type, OBS Path, Project(s) and Project Manager.
 -
 Are you leveraging Clarity's Roadmaps to support some of the best and most common practices found across industries? Come to this session to learn how Roadmaps work out of the box. We will cover how to configure views, targets, widgets, boards and more! You will leave with great ideas you can bring back to your organization!
 -
 This session will align you with some of the best and most common practices for using Clarity's Resource Management capabilities. Come and learn about the capabilities that come out of the box for resource insights like allocations, assignments, availability and more. Additionally, tips and tricks will be discussed leaving you with a toolkit of ideas for your organization!
 -
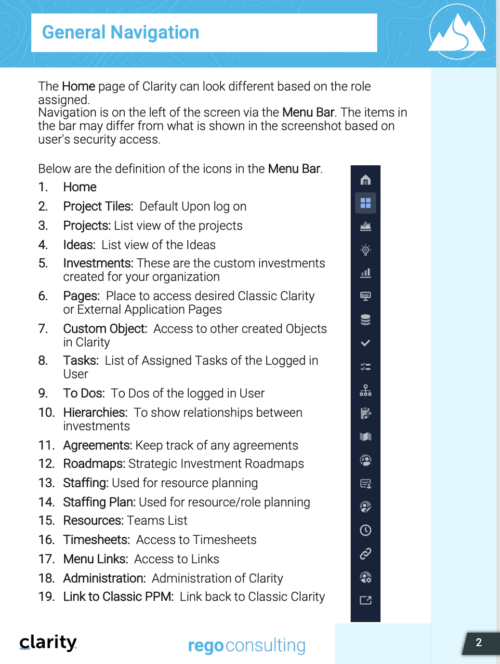
 This training document is a Rego Consulting Quick Reference Guide to assist with General Navigation in Clarity’s Modern User Experience. This doc references version 16.0 views. Doc reviews the Menu Bar and User Tool Bar.
 -
 A Quick Reference Guide to assist in configuring the layout of Ideas and Custom Investments in Clarity’s Modern UX via Blueprints. Reviews the configuration process including changes to Details and Modules.
 -
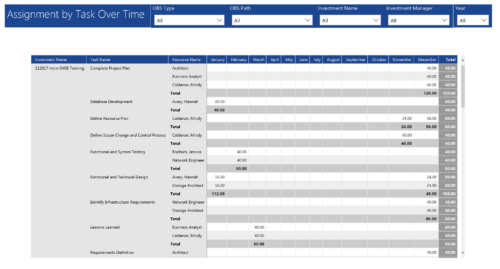 Assignments by Task Over Time report display all assignments by task for all resources. Information is displayed on monthly basis. This report displays Investment Name, Task Name, Resource Name and its monthly assignments. You can further narrow your search by OBS Type & Path, Investment Manager, Investment Name, and Year
 -
 “Real” Resource management is not for the faint of heart. To get a solid picture of the actual capacity multiple dimensions have to be considered: projects, daily business, absences, different work hours and more. In this session we will demonstrate how this can be done with the help of “Advanced Resource Planning” in Clarity. We will staff projects in seconds, simulate different options, jog new projects in and finally simulate the resource aspect of whole Roadmaps.
 -
 A slide deck used in Rego’s training classed for Project Management in the Modern User Experience. Reviews terms and definitions, the OBS, Work Breakdown Structure, Templates, Roles and Responsibilities, Allocation vs ETC, Accessing Projects, Project Creation, Staffing, Tasks, Assignments, To Dos, Project Financials, and more.


Copyright 2023 • Rego Consulting Corporation • Privacy Policy