-
 This training document is a Rego Consulting Quick Reference Guide to assist with Entering and Submitting Time in Clarity’s Modern User Experience. This doc references version 16.1.2 views. Document includes Accessing & Selecting Timesheets, Populate Timesheet, Updating Timesheet, Submitting Timesheet and Entering Time for Someone Else.
 -
 This training document is a Rego Consulting Quick Reference Guide to assist resource managers with the approval of timesheets via the Review & Approve tab. This doc references version 16.1.2 views. Doc reviews accessing and selecting timesheets, reviewing submitted timesheets, approving timesheets, approving multiple timesheets, returning timesheets and the timesheet grid.
 -
 This training document is a Rego Consulting Quick Reference Guide to assist with the utilization of some of the most common components in Clarity’s Modern User Experience. This doc references version 16.1.2 views. Document includes content on Grid View, View Options, Adjust Columns, Details Panel, Group By, Save Views and Manage Views.
 -
 A presentation slide deck from RegoU 2023. This course covered the various visualization tools available in Clarity and help you understand the best way to output your data.
 -
 Do you want to talk to other customers that are using or plan to use portfolio management? In this moderated Round Table where customers can share experiences and provide insights on process, configurations, challenges, and successes. We will have an expert panel and then divide into small groups and discuss customer selected topics - 100% sharing.
 -
 Are you looking to extend your investment in Clarity and share it with other stakeholders in your company? We know organizations today are looking for cool collaborative ways to work. Come check out what Clarity has to offer.
 -
 Has your organization made significant investments in technology solutions without seeing precise results? Do you have the right capabilities yet lack an interconnected, end-to-end solution? Come to this session to learn more about the importance of a living strategic roadmap and how Rego's Digital Ecosystem Assessment program can help. This session will review the key elements needed to create an effective roadmap that can drive increased maturity and excitement within your organization, and how that roadmap can help optimize your digital ecosystem.
 -
 Are you on an older version of Clarity? Do you want to understand the value of the new features and functions in recent versions? This class is a demonstration of the new features and the value of these features for customers.
 -
 Learn how Apptio BI, an intuitive ad-hoc reporting solution, serves as a one-stop shop for custom data needs, saving time and energy for TBMAs. This hands-on session will guide you through setting up Apptio BI, discuss best practices for deployment, and demonstrate how it unifies the best aspects of ApptioOne and Cloudability for a holistic understanding of IT spend. Master the fundamentals of creating an Apptio BI dashboard and optimize your IT financial management experience.
 -
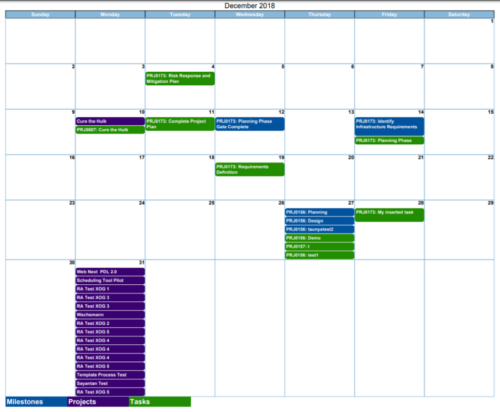
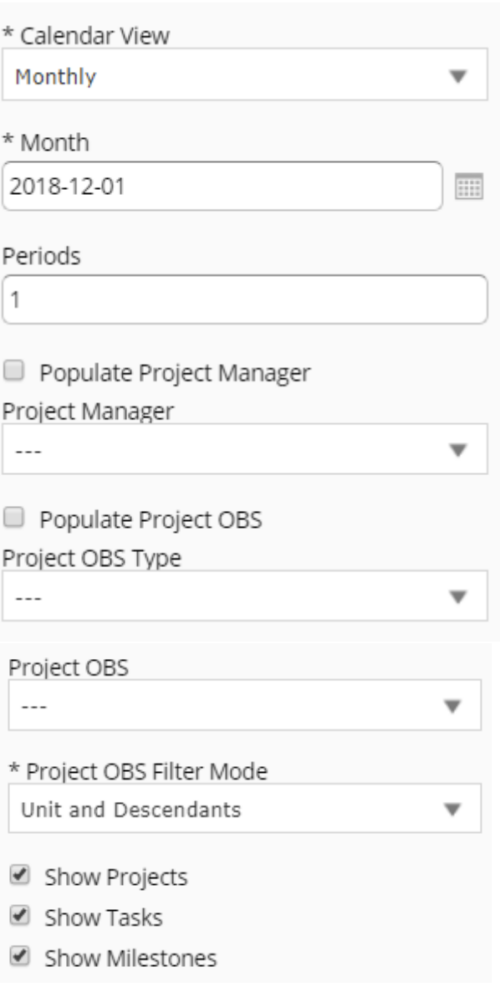 Calendar View report provides a view of Projects, Milestones or Tasks that has finish date within the user selected month. User has the flexibility to choose to Calendar view as Monthly or Weekly and also number of periods that needs to be displayed in the report. Report can be filtered to show only Projects or Milestones or Tasks with the checkboxes provided. It can also be further filtered using Project Manager and Project OBS parameters.
 -
 This portlet shows the project costs by Month. The information displayed includes:
- Start Date for project
- End Date for project
- Budgeted Cost
- Planned Cost
- Actual Hours
-
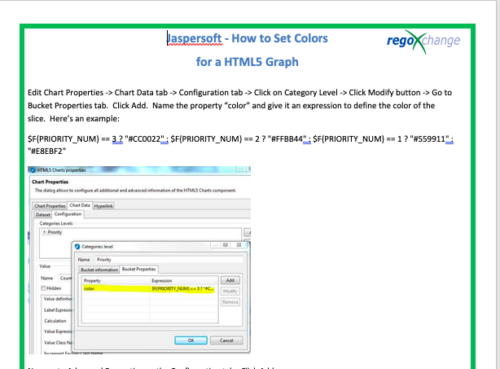 This tech-trick details the steps to set colors for an HTML5 Graph.


Copyright 2023 • Rego Consulting Corporation • Privacy Policy