-
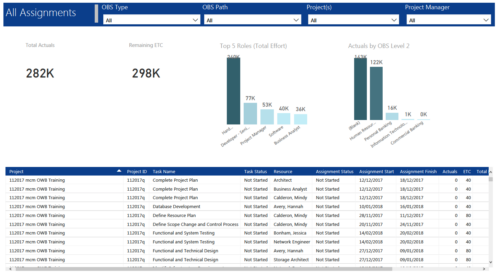 All Assignments report provides project managers a single place to view KPIs related to Task Assignments. All the KPIs are depicted in various visualizations. Total Actuals: Scorecard that displays the sum of actuals associated with assignments for the selected criteria. Remaining ETC: Scorecard that displays the sum of current ETC associated with assignments for the selected criteria. Top 5 Roles (Total Effort): Column chart that displays Effort (Actuals + ETC) by Roles. X axis displays various Roles. Data labels indicate sum of effort associated with that Role. Actuals by OBS level 2: Column chart that displays Actuals by OBS level 2. X axis displays various OBS level 2. Data labels indicate sum of actuals associated with that OBS. Grid: Displays Assignment details such as Project ID, Project Name, Task Name, Task Status, Assigned Resource, Assignment Status, Assignment Start, Assignment Finish, Actuals, ETC, Total Effort, Days Late and Days Old. You can further narrow your search by OBS Type, OBS Path, Project(s) and Project Manager.
 -
 A Rego Training deck that reviews the use of Hierarchies in Clarity PPM’s Modern UX.
- Hierarchies in Clarity PPM can be used to create one or more hierarchies that define relationships between various investments. Each hierarchy includes an investment tress card made up of multiple cards.
- A parent-child relationship between investment cards help stakeholders understand the dynamics of the investments. Stakeholders can use the Hierarchies page to view all the hierarchies in the organization.
- Hierarchies can include different investment types such as; ideas, projects, and custom investments with configurable cards by investment type.
- Hierarchies can display rolled up aggregation metrics.
- Hierarchies can be exported to PDF.
-
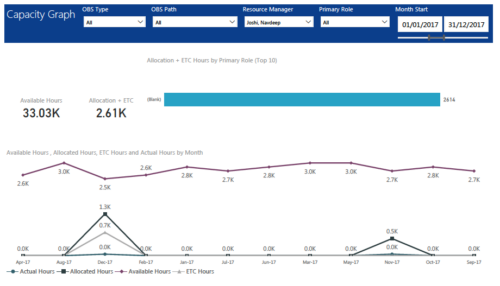 Capacity Graph report displays Availability, Allocations, Actuals and Assignments for one or more active resource(s) in a single view. Report contains the following components: KPIs: Displays Available hours, Allocation + ETC for filtered criteria. Bar graph: Displays Allocation + ETC by primary role Line chart: Displays Availability, Allocations, Actuals and Assignments by time period. This portlet provides Resource Managers, PMOs and Executives with a simple way to analyze: Allocations vs. Availability, Allocations vs. Actuals, Allocations vs. ETC and ETC vs. Availability. User can further narrow their search by OBS Type & Path, Resource Manager, Primary Role, Start and End Date.
 -
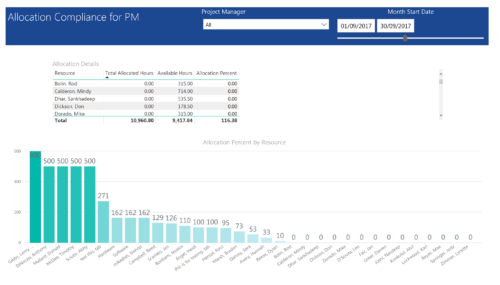 Allocation Compliance by PM report provides project managers a single place to view Available hours, Allocation Hours and Allocation Percentage of Investment Team Resources. It considers the investments of selected project manager and it displays the following: Allocation Details Grid: Displays Resource and its Allocated hours, Available hours and Allocation percentage (Allocated hours/Available Hours) Allocation Percent by Resource: Column chart that displays Allocation Percentage for various resources during the selected Time frame. You can further narrow your search by Project Manager & Month Start Date range.
 -
 Are you using Clarity's roadmap leveraging some of the best and most common practices found across industries? Come to this session to learn about how the roadmap works, out of the box. We will cover how to configure views, targets, widgets, boards and more! You will leave with great ideas you can bring back to your organization!
 -
 This session will aligning you with some of the best and most common practices for using Clarity's Resource Management capabilities. Come and learn about the cababilities that come out of the box for resource insights like allocations, assignments, availability and more. Additionally, tips and tricks will be discussed leaving you with a toolkit of ideas for your organization!
 -
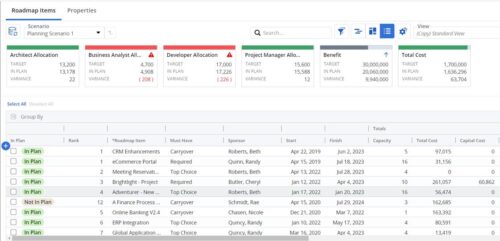 This Roadmap add-on provides configurable Role-based metrics that can be used in the grid view as targets and constraints. Select your valuable roles in the “targets” and once selected, the “sync” button will bring in any current allocations against projects and allow editing any of the total numbers directly in a scenario. This will provide deeper insights into impacts of plans on teams/resources in addition to the out of the box money and time constraints.
 -
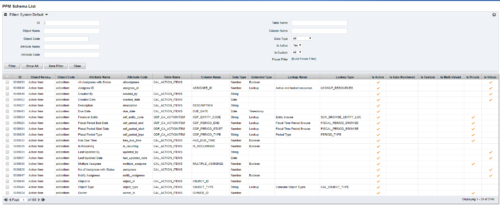 The PPM Data Dictionary Extractor pulls schema and attribute information from each object in CA PPM and places it in a custom object. The following fields provide details information about each attribute in the CA PPM Instance.
- Object Name – The name of the object to which the attribute belongs
- Object Code – The external ID of the object to which the attribute belongs
- Attribute Name – The name of the attribute
- Attribute Code – The external ID of the attribute
- Partition Code – The partition to which the attribute belongs
- Table Name – The database table where the attribute is located
- Column Name – The database column name of the attribute
- Data Type – The data type of the attribute
- Data Size – The character limit of the attribute
- Data Scale – The scale of numeric attributes
- Is Active – Specifies if the attribute is active
- Extended Data Type – The extended type of the attribute (ex: lookup, money, etc.)
- Lookup Name – The name of the attribute’s lookup
- Lookup Type – The external ID of the attribute’s lookup
- Default Value – The default value assigned to the attribute
- API Alias – The REST API alias assigned to the attribute
- Max Value – The maximum value accepted by the attribute
- Min Value – The minimum value accepted by the attribute
- Curve Name – The name of the Curve for Time-Scaled value attributes
- Curve Type – The type of the Curve for Time-Scaled value attributes
- Is Custom – Is the attribute a stock attribute or custom
- Is Auto-Numbered – Is auto-numbering enabled for the attribute
- Is Multi-Valued – Is the attribute a multi-valued lookup
- Is DWH Enabled – Is the attribute enabled for export to the data warehouse
- Is Editable – Is the attribute editable or read-only
- Is Required – Is the attribute required
- Is Virtual – Is the attribute a virtual attribute
- Is Private – Is the attribute a private attribute used by the application behind the scenes
-
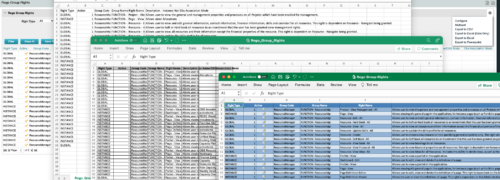
 The Rego Group Rights portlet is a useful list view for functional administrators. It provides a flat view of all the Global, OBS and Instance rights that have been granted to all the groups in Clarity. It can be further filtered by just the rights type and/or the security group. It is also possible to export out to file in spreadsheet (csv, xlsx) or PowerPoint formats with OOB Clarity functionality.

