-
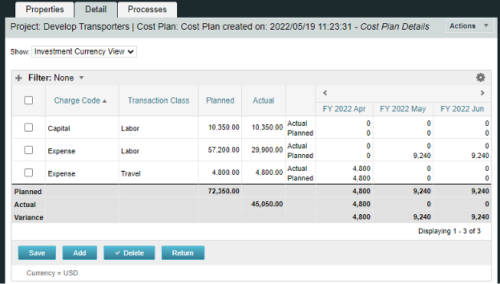
A process creating a new Cost Plan. Cost Plan properties:
Pre-conditions:Name Cost Plan created on: yyyy/mm/dd hh:mm:ss Grouping attributes Charge Code, Transaction Type Start Period The earliest fiscal period with Actuals (from PPA_WIP table) or current period, if there are no actuals Finish Period The latest fiscal period with a non-zero allocation (from PRJ_BLB_SLICES table, SLICE_REQUEST_ID = 6 Period Type Monthly Plan of Record True Planned Cost For periods in the past – from Actuals (Charge Code, Transaction Type, Quantity (Units), Cost (Amount) taken from Transactions (PPA_WIP & PPA_WIP_DETAILS); For current and future periods – from Allocations (Charge Code taken from the Project, Transaction Class from the Resource, Quantity from allocation slices, Cost from the Rate Matrix (NBI_PROJ_RES_RATES_AND_COSTS table) - the Project must be financially enabled.
- if a new Team Member is added, Rate Matrix job must be run, so the rates are populated in the NBI table.
- if the Allocation changes, allow the timeslice job to finish before running the process.
- the Project should have the Charge Code set.
-
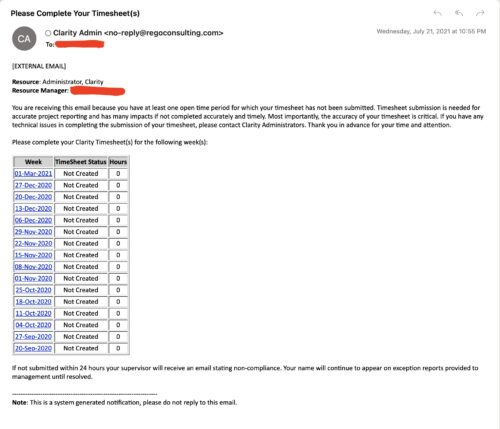 The Enhanced Time Tracking Stalker – RM workflow process automatically sends a single email to Resource Managers which contains a list of any of their resources that have not submitted their timesheet for a prior open time period. The email informs the RM if their resources are submitting their timesheets on time. The email includes a table that provides this information for each resource: Resource Name, Time Period, Timesheet Status and Total Hours saved on the timesheet with links to the timesheet in the Modern User Experience of Clarity. These notifications will help to ensure that time is being posted and approved in a timely manner.
 -
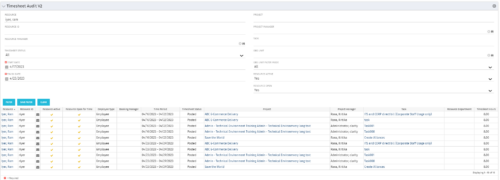 The Timesheet Audit portlet displays timesheet information in order to perform an audit. The only required data needed to search the portlet is start and finish date. Additionally, you may narrow the results by filtering by resource, resource ID, OBS Unit, resource manager, timesheet status, project, and task. The portlet provides reporting on the following:
- Resource
- Resource ID
- Email Icon of Resource (So the reviewer can quickly email the Resource)
- Resource is Active
- Resource Open for Time
- Time Period (Start and Finish Dates)
- Timesheet Status
- Is Adjustment (If the timesheet is adjusted)
- Timesheet Modified Date
- Timesheet Posted Date
- Timesheet Submitted By
- Timesheet Approved By
- Project
- Task
- Proposed ETC Hours
- Pending Actual Hours
- Total Actual Hours
-
 This training document is a Rego Consulting Quick Reference Guide to assist with the saving and managing of Roadmap views in Clarity’s Modern User Experience. This doc references version 16.1 views. Document provides detail on the Save As feature for Roadmap views. Detail is provided on views created by others, how to manage existing views and how to save them as favorites. Timeline, Board and Grid view saving options are detailed.
 -
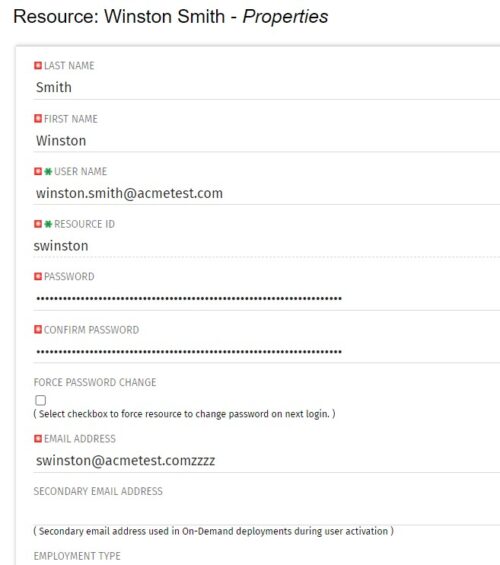 The Update Email Ids workflow sets all users’ email addresses to non-working by appending a “ZZZZ” to the end of the email address. This process is used for when there are refreshes to your Development or Testing environments and do not want emails going to users. When complete, the log will display the total amount of email addresses updated. A second process is included in this workflow that will revert the email addresses to remove the “ZZZZ” added in the first workflow. In some instances, the process may be run in error, or you may want to send emails from a Development or Testing environment; using this second process you will be able to enable all emails again.
 -
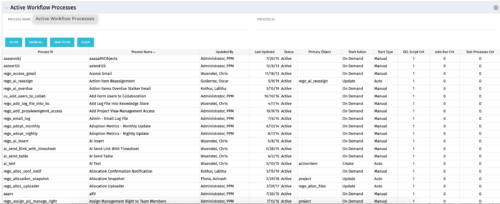 The Active Workflow Processes allows you to view all of the workflow processes within the system. It shows information about the process: the objects related, the start type, and if the process has sub-processes, jobs, or GEL scripts. This portlet is used by admins to determine how many processes are currently running in the system and on which objects. It will also display the start action, how many GEL scripts reside in the process, the run count and how many the sub-processes each process has. This information is helpful during upgrades and other testing.
 -
 A Quick Reference Guide to assist in the process of associating an OBS with User Access in Clarity’s Modern User Experience. An Organizational Breakdown Structure (OBS) can be used for user access control. Perform these steps if the OBS is required for managing access rights for objects such as resources and investments. Note: the following steps apply to non-financial OBSs and the OBS must exist in the system.
 -
 A Quick Reference Guide to assist in the creation of Action Items in Clarity’s Modern User Experience. The Action Items tile in Administration serves as a way to create Action Items in MUX without having to use Classic and create processes. Administrators can use the Action Items to create, update, and delete Action Items that can be triggered through Business Rules.


