-
 This round table discussion will focus on Clarity configurations using Studio. A well-configured Clarity environment will minimize performance bottlenecks, ease development, and increase end user adoption. Join us to discuss best practices around object structure, naming conventions, audit trail settings, and more.
 -
 Value Stream Management (VSM) isn’t just another buzzword; it’s the visibility layer your digital transformation is starving for. In this session, learn how to map, measure, and maximize value across the entire delivery lifecycle.
 -

- Introduction to Power BI and its components
- Getting Data
- Mockup – PM and RM Dashboard
- Publishing and Sharing
- Best practices and its limitations
- Tableau Introduction
-
 A Quick Reference Guide to assist in the use of Blueprints/Channels to access external sites, applications or Classic PPM in the Modern UX of Clarity. Reviews the configuraton process.
 -
 A Quck Reference Guide to assist in the application of Field Level Security for Groups in Clarity’s Modern UX. Reviews the process of applying security to specific fields for specific groups.
 -
 A Quick Reference Guide to assist in configuring the layout of Ideas and Custom Investments in Clarity’s Modern UX via Blueprints. Reviews the configuration process including changes to Details and Modules.
 -
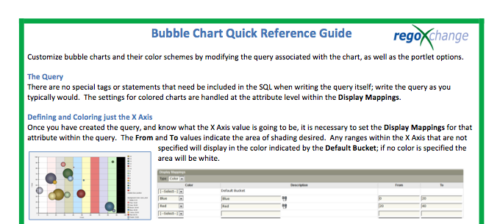 The Bubble Chart Quick Reference Guide provides the user instructions to customize bubble charts and their color schemes by modifying the query associated with the chart, as well as the portlet options. This is very beneficial as it allows the user to match or blend colors among all of the bubble portlets to better display the information the portlets are delivering. Similar data can be one color while different data can be its own color to better show the overall picture.
 -
The Bubble Chart Quick Reference Guide provides the user instructions to customize bubble charts and their color schemes by modifying the query associated with the chart, as well as the portlet options. This is very beneficial as it allows the user to match or blend colors among all of the bubble portlets to better display the information the portlets are delivering. Similar data can be one color while different data can be its own color to better show the overall picture.
-
 Bar Chart displays average percent variance for all active projects by OBS unit. Percent variance = Planned Cost - Budgeted Cost / Budgeted Cost * 100. Projects with no Budgeted Cost are ignored for the calculation. Then all project variance percentages are algebraically added (some may be negative), and divided by total projects with a variance. This yields the Average Percent Variance. This calculation is performed for active projects in each OBS unit. OBS units include all units at all levels where projects are attached. Portlet filterable by OBS, Financial Status, and Financially Approved. Vertical axis = OBS Unit Name. Horizontal axis = Variance Percent. Data value = Average Percent Variance. Mouseover value = OBS Name + Average Variance Percent.
 -
Bar Chart displays average percent variance for all active projects by OBS unit. Percent variance = Planned Cost - Budgeted Cost / Budgeted Cost * 100. Projects with no Budgeted Cost are ignored for the calculation. Then all project variance percentages are algebraically added (some may be negative), and divided by total projects with a variance. This yields the Average Percent Variance. This calculation is performed for active projects in each OBS unit. OBS units include all units at all levels where projects are attached. Portlet filterable by OBS, Financial Status, and Financially Approved. Vertical axis = OBS Unit Name. Horizontal axis = Variance Percent. Data value = Average Percent Variance. Mouseover value = OBS Name + Average Variance Percent.
-
 This training document is a Rego Consulting Quick Reference Guide to assist with the creation of Budget Plans in Clarity’s Modern User Experience. The document reviews submission of a cost plan for approval, approving or rejecting submitted budgets and Budget Plan facts.


Copyright 2023 • Rego Consulting Corporation • Privacy Policy