-
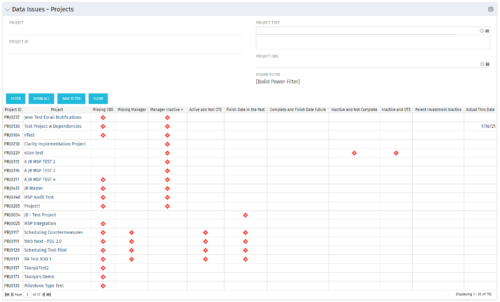 The Project Data Issues portlet is used to identify data exceptions related to project setup. This portlet helps to identify where projects are missing key data or are possibly sitting in an exception state. This view will show projects that have one or many exceptions, including inactive projects. The user may also narrow the results by project, OBS, or project type.
 -
The Project Data Issues portlet is used to identify data exceptions related to project setup. This portlet helps to identify where projects are missing key data or are possibly sitting in an exception state. This view will show projects that have one or many exceptions, including inactive projects. The user may also narrow the results by project, OBS, or project type.
-
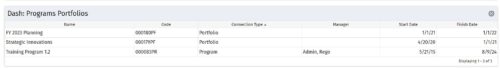 The Dashboard: Programs Portfolios portlet is placed on the dashboard page of a project. This portlet will show any programs or portfolios the project is a subproject of. The portlet will display the name, code, connection type, manager, and start/finish dates.
 -
The Dashboard: Programs Portfolios portlet is placed on the dashboard page of a project. This portlet will show any programs or portfolios the project is a subproject of. The portlet will display the name, code, connection type, manager, and start/finish dates.
-
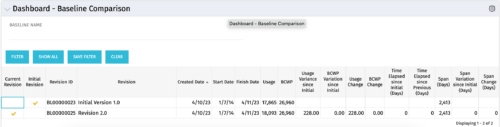 The Dashboard: Baseline Comparison portlet compares multiple baselines on a single project. The portlet is added to the dashboard page of a project and will pull in both baselines for that project and perform a comparison between the two. This portlet provides a quick way for project managers to view the differences between their baselines, especially if they have multiple members updating the project.
 -
The Dashboard: Baseline Comparison portlet compares multiple baselines on a single project. The portlet is added to the dashboard page of a project and will pull in both baselines for that project and perform a comparison between the two. This portlet provides a quick way for project managers to view the differences between their baselines, especially if they have multiple members updating the project.
-
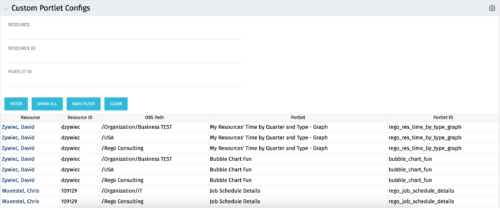 The Custom Portlet Configs portlet will display all portlets where the user has modified any settings like the filter or list views. This portlet is helpful for troubleshooting and to determine which users may be affected during an upgrade. The portlet may be filtered by several criteria and displays the resource name, ID, OBS path, portlet, and portlet ID.
 -
The Custom Portlet Configs portlet will display all portlets where the user has modified any settings like the filter or list views. This portlet is helpful for troubleshooting and to determine which users may be affected during an upgrade. The portlet may be filtered by several criteria and displays the resource name, ID, OBS path, portlet, and portlet ID.
-
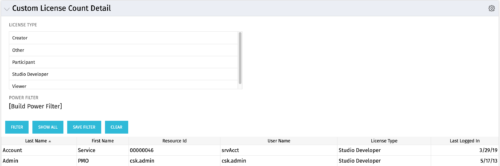 The Custom License Count Detail portlet displays the license type information for all users within Clarity as well as last login date for clean-up. This portlet can be modified by adjusting the query to exclude certain rights within manager licenses based on negotiated license types with CA. For example, if CA allows creation of a sub-object to Incident to be included in a Team Member license, this portlet can be used to reflect the true license counts vs. the standard CA license counts.


Copyright 2023 • Rego Consulting Corporation • Privacy Policy