-
 The Scheduled Jobs Cleanup process removes all completed job instances that have run before a date set by the administrator. The administrator may use the gel parameter to update the amount of days since each job has run. Based on that date, the workflow will eliminate all jobs that have surpassed that threshold. This workflow helps administrators maintain the job logs and queue by eliminating jobs that users have potentially forgotten to remove on their own.
 -
 We will delve into various examples of how to use Apptio reports to identify cost-saving opportunities within your organization and how to quantify them for leadership. We will cover specific areas such as databases, migrating servers to the cloud, rationalizing applications with high unit costs, replacing or decommissioning obsolete servers, and managing unassigned end-user devices.
 -
 Join us to discuss one of the most important - but also one of the most confusing Clarity topics - security. Learn how an OBS can be utilized to control security, how security permissions can be granted and revoked, and the pros and cons of the different types of security permissions.
 -
 The Self Assign workflow process updates a selected resource field on an object based on someone checking a boolean field on the same object. Using this process, whomever is editing the object, will be placed in this field automatically eliminating the need for each user to come in and update the field manually. The field will run when the Boolean is ticked and the user saves the page. It is important to note that the page will need to be reloaded to see the changes reflected. This can be used as a fast way to self-assign yourself to an object - you can create a boolean field that is checked and have the process assign you to that item.
 -
The Self Assign workflow process updates a selected resource field on an object based on someone checking a boolean field on the same object. Using this process, whomever is editing the object, will be placed in this field automatically eliminating the need for each user to come in and update the field manually. The field will run when the Boolean is ticked and the user saves the page. It is important to note that the page will need to be reloaded to see the changes reflected. This can be used as a fast way to self-assign yourself to an object - you can create a boolean field that is checked and have the process assign you to that item.
-
 Course Description: Do some folks in your organization view Clarity PPM as worthless or of little value? In this class, we will discuss how to increase the value perception of Clarity PPM and innovative ways to sell the value Clarity PPM provides to stakeholders and users.
 -
 Course Description: For clients that have both ServiceNow and Clarity PPM, passing information between the systems becomes vital for the enterprise with ITSM, demand, and PPM toolsets. One of the biggest areas of interaction is around demand management. Come and see Rego's integration solution, which flexibly allows for ServiceNow records (incident, problem, idea, enhancement, and demands) to generate Clarity PPM ideas or projects.
 -
 This process must be run using the “Execute a Process” job. Job may be scheduled or run on-demand. Process pulls Availability Rate from the Availability blob for each resource, where blob is not null. Then it populates this value into a custom Daily Availability attribute (Number field with 2 decimals) on the Resource object. This field does not have to be displayed to be used for reporting. Because the OOB Availability Rate field is stored only in a blob, it is difficult to include in portlet or report output. The use of this custom attribute makes the value easily reportable.
 -
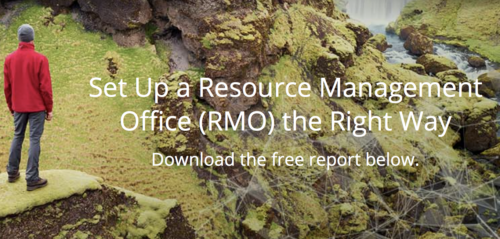 Resource Management - Are You Doing it Right? Companies of all shapes and sizes need to know if they have the right people working on the right things at the right time, to meet their objectives. Rego's own Grant Zemont has put together this report to help your company learn the best practices for setting up a resource management office correctly. Download the free report here. This White Paper is downloaded from the Rego Consulting site. You will be asked to provide your email address and current ppm tool. - http://info.regoconsulting.com/rmo-report ** Do not Add to Cart - No Downloadable File**
 -
 Course description: “Does your organization struggle with resource management? Have you considered creating a Resource Management Office (RMO)? This session will review how some organizations are using RMOs to drive adoption and effectively manage resources, including real world examples of RMO setup and execution.” Download file is the presentation slide deck.
 -
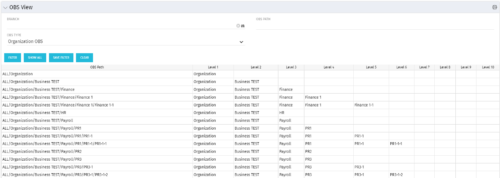 This grid portlet shows the OBS name and ID along with the associated hierarchy, both as an aggregated view along with each of the levels broken out. The table below describes the available filter fields in the portlet.
Column Label Description Branch Branch of the OBS OBS Type OBS to use OBS Path Path of the OBS -
This grid portlet shows the OBS name and ID along with the associated hierarchy, both as an aggregated view along with each of the levels broken out. The table below describes the available filter fields in the portlet.
Column Label Description Branch Branch of the OBS OBS Type OBS to use OBS Path Path of the OBS


Copyright 2023 • Rego Consulting Corporation • Privacy Policy