RegoXchange
  • Learn how Apptio BI, an intuitive ad-hoc reporting solution, serves as a one-stop shop for custom data needs, saving time and energy for TBMAs. This hands-on session will guide you through setting up Apptio BI, discuss best practices for deployment, and demonstrate how it unifies the best aspects of ApptioOne and Cloudability for a holistic understanding of IT spend. Master the fundamentals of creating an Apptio BI dashboard and optimize your IT financial management experience.
  • A presentation slide deck from Rego University 2022.   This deck reviews Apptio’s self-service reporting tool.  This tool is geared towards end users and empowers them to create and share their own reports.
  • A presentation slide deck from Rego University 2022.   This document reviews how Clarity and Apptio can work together.
    • Typical Challenges
    • Apptio Introduction
    • Clarity / Apptio Solution
    • Rego’s BETA Integration
  • Does your organization own Apptio or looking to purchase it? In this session we will dive into what Apptio is and how it complements your current Clarity solution.
  • Does your organization own Apptio or looking to purchase it?  In this session we will dive into what Apptio is and how it complements your current Clarity solution.
  • Does your organization own Apptio or looking to purchase it?  In this session we will dive into what Apptio is and how it complements your current Clarity solution.
  • A presentation slide deck from RegoU 2023.  This course was a presentation by Apptio on their Product Roadmap.
  • This training document is a Rego Consulting Quick Reference Guide to assist with timesheet approval in Clarity’s Modern UX.  The doc reviews Accessing and Selecting Timesheets, Reviewing Submitted Timesheets, Approving Timesheets, Returning Timesheets and the Timesheet Grid.
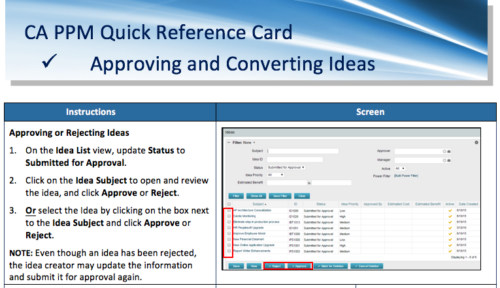
  • A Quick Reference Card to assist in the approving/rejecting of Ideas.  Included converting Ideas once approved.
  • The Application Risk by Goal portlet displays a count of active applications by goal with a sub-count by risk. The graph is color-coded by risk rating:
    • 1-33 – Green
    • 34-66 – Yellow
    • 67-100 – Red
    The portlet provides a quick overview of the risk rating for each application within each goal.
Go to Top