-
 A presentation slide deck from RegoU 2023. This course covered the work that Rego has done over the past year as well as upcoming innovations to enhance Clarity.
 -
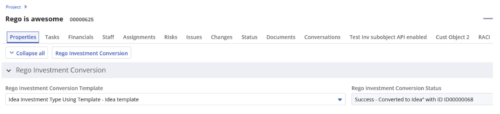
 Converts one Investment type to another investment type. Functionality • One investment type instance converted to another investment type • Investment object level attributes are copied over by default • Investment sub-objects can be chosen to be copied • The attributes and sub-objects to be copied to must be api enabled • Can convert from non api enabled object like other work to api enabled Custom CIT • Attribute mapping does not support multivalued lookups yet • If auto-numbering is not enabled for target investment type of the sub-objects, an ID will be auto-generated. • Associated risks and issues will not be copied over • Target investment status will be "Unapproved" • If there are Mandatory target investment type attributes either o use a template to convert where having a value in the attribute is not mandatory or Have a default value in the mandatory field defined on the object • If effort task creation is enabled, the effort task will also be brought over. o The effort task will appear with custom code if a investment template is used for conversion • The allocations will extend to the finish of the new investment if investment template is used which has tasks • Almost 500 instances of sub-objects are supported at this point. • The values in lookups need to be active or the process will error out • All required attributes must be api enabled
 -
 The Rego PowerBI Reporting Suite features close to 100 free PowerBI reports, designed to enhance project management and reporting capabilities.
 -
The Rego Roadmap Conversion process provides the ability to create investments, from Roadmap Items. - Create a roadmap and populate it with Roadmap Item(s). It is useful to create a custom view which contains the attributes needed in the project, or Custom Investment, to be created.
- Create a view to be used to help with the Conversion process. It should include: -
- Roadmap Item: This will become the Investment Name
- Convert to: The type of investment to be created.
- Conversion - Use Template: The template to use in the conversion process.
- Sync Status: The status of the conversion process
- Sync Message: additional details for the conversion process
- In addition, check the Scenario that is selected.
- In the Properties > Actions menu select Convert to Investment
- This will initiate the conversion process and will select the roadmap items that: -
- have no linked to set.
- have both the Convert to and Conversion Use Template selected.
- If any of these details are empty the roadmap item will be ignored.
- The Sync Status and Sync Message will be updated to show whether the conversion has completed successfully, or not.
- The Linked to will be populated with the newly created investment.
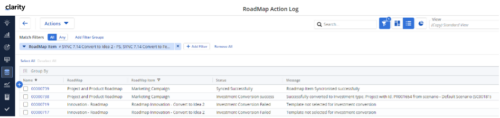
- There is a Roadmap Action Log which can be accessed via Custom Objects. This is useful for administrators and tracks all actions undertaken by the Conversion Process. A history of the conversions completed, and their sync status and messages can be accessed from here.
-
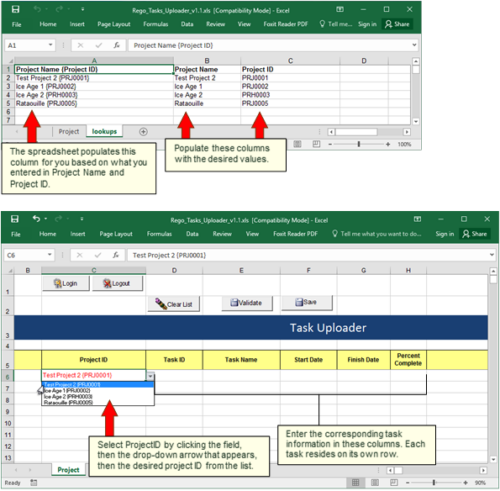 Take your project task information straight from Excel right into CA PPM. Task Name, Start Date, Finish Date and Percent Complete can all be imported or updated directly. Other fields can be added with a short Rego Consulting engagement. Installation of the base app requires 10 hours of Rego Consulting engagement time. Since this item requires Rego staff and hours (see special instructions) to install, download items are informational only. Install files will be utilized by Rego staff.
 -
 Have you looked in the regoXchange or reviewed Rego’s innovation offerings? This class will show you the power of Rego’s pre-built content library, integrations, and other assets. See example after example of portlets, processes, and materials you can use to add value to your instance of Clarity. Learn how you can introduce email-based approvals with Rego's action item responder. Get a peek at Rego's new MSP integration that avoids the issues faced with the OOTB integration. Finally, understand Rego's pre-built connectors and how they can benefit your instance. Including blueprint migrator. Include free tools like GEL builder, query, XOGbridge.
 -
 With only 15% of companies successfully transforming digitally, it’s time for the PMO to take charge. This session talks about how the PMO effectively can support the digital transformation within the enterprise by reimagine its traditional charter
 -
 A process that removes all the group assignments for inactive users after execution of process. The following are removed for all inactive users:
- Group assignments
- Instance rights
- Global rights
-
A process that removes all the group assignments for inactive users after execution of process. The following are removed for all inactive users:
- Group assignments
- Instance rights
- Global rights
-
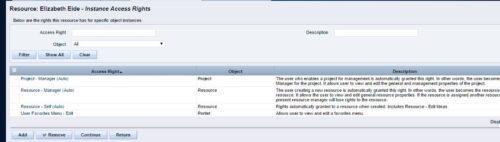
 This can be used to remove all participants and their corresponding security permissions. NOTE: The ability to remove the right is with the admin only.
 -
This can be used to remove all participants and their corresponding security permissions. NOTE: The ability to remove the right is with the admin only.


Copyright 2023 • Rego Consulting Corporation • Privacy Policy