-
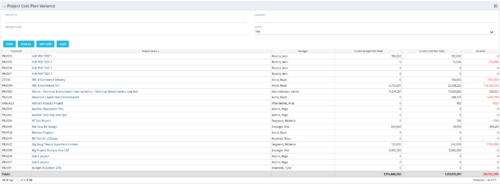
 The Project Cost Plan Variance displays the variance between the budget and cost plans for projects the logged in user has security rights to view. The total for the Cost Plan that is marked as the Plan of Record for the project (Current Cost Plan Total), alongside the total for the current approved Budget Plan (Current Budget Plan Total). These two values are then compared in order to generate the total current Variance for the project. A positive amount in the Variance column indicates the project is under budget, while a negative amount indicates the project is over budget. Results may be filtered by: Project ID, Project Name, Manager, and whether the project is Active (Yes, No, All). By default, the portlet will display only Active projects.
 -
 The Projects by Stage and Manager portlet displays all active projects (excluding programs), with a project stage and project manager. The portlet color codes the different stages that and counts the number of projects in each stage by project manager. This portlet provides a quick snapshot of all projects with stage details so the PMO may get an overview of where certain projects are sitting with each Project Manager.
 -
 The Projects by Stage and Manager portlet displays all active projects (excluding programs), with a project stage and project manager. The portlet color codes the different stages that and counts the number of projects in each stage by project manager. This portlet provides a quick snapshot of all projects with stage details so the PMO may get an overview of where certain projects are sitting with each Project Manager.
 -
 The Projects by Stage and Manager portlet displays all active projects (excluding programs), with a project stage and project manager. The portlet color codes the different stages that and counts the number of projects in each stage by project manager. This portlet provides a quick snapshot of all projects with stage details so the PMO may get an overview of where certain projects are sitting with each Project Manager.
 -
 The Projects Marked for Deletion portlet displays information about projects that are currently pending deletion but excludes templates and programs. This portlet provides an easy way to view all projects that are marked for deletion before the background job actually erases them. The portlet provides all necessary information as well as the project manager in case there are questions about why the project was marked for deletion.
 -
 The Projects Marked for Deletion portlet displays information about projects that are currently pending deletion but excludes templates and programs. This portlet provides an easy way to view all projects that are marked for deletion before the background job actually erases them. The portlet provides all necessary information as well as the project manager in case there are questions about why the project was marked for deletion.
 -
 The Projects Marked for Deletion portlet displays information about projects that are currently pending deletion but excludes templates and programs. This portlet provides an easy way to view all projects that are marked for deletion before the background job actually erases them. The portlet provides all necessary information as well as the project manager in case there are questions about why the project was marked for deletion.


