-

 This training document is a Rego Consulting Quick Reference Guide to assist with the utilization of Tasks and To Do’s in Clarity’s Modern User Experience. This doc references version 16.3 views. Document references the Tasks and To Do’s menu items and their associated widgets.
 -
 This session will align you with some of the best and most common practices for using Clarity's Project Management capabilities. Come and learn about the capabilities that come out of the box for excellent project management. Things like scheduling, assignments, staffing, views, financial plans and other general project management capabilities will be covered. Additionally, tips and tricks will be discussed leaving you with a toolkit of ideas.
 -
 Do you want to understand the OOTB configuration and functionality of financial management? In this class, we will review the OOTB objects, views, views, and functions of financial plans, rates, and other related areas.
 -
 Do you want to understand Best Practice of configuration and functionality for demand management? In this class, we will review the OOTB objects, views, and functions of Ideas, along with tips and tricks to support your Demand Management processes.
 -
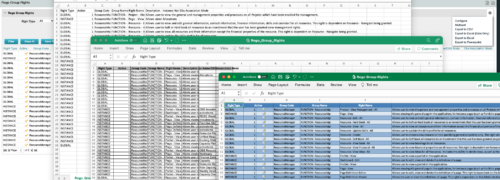
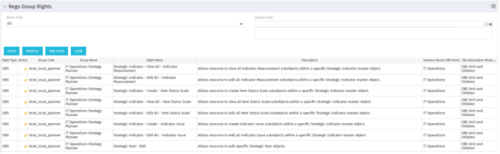 The Rego Group Rights portlet is a useful list view for functional administrators. It provides a flat view of all the Global, OBS and Instance rights that have been granted to all the groups in Clarity. It can be further filtered by just the rights type and/or the security group. It is also possible to export out to file in spreadsheet (csv, xlsx) or PowerPoint formats with OOB Clarity functionality.
 -
 This training document is a Rego Consulting Quick Reference Guide to assist with the creation of Hierarchies in Clarity’s Modern User Experience.
 -
 This training document is a Rego Consulting Quick Reference Guide to assist with the creation and management of Ideas in Clarity’s Modern User Experience. The document reviews Creating an Idea and Editing of an Idea.
 -
 This training document is a Rego Consulting Quick Reference Guide to assist with adjustments to timesheet in Clarity’s Modern User Experience.
 -
 A Quick Reference Guide to assist in using the Hierarchies Grid view in Clarity’s Modern UX. The Hierarchy grid provides the ability to create new hierarchies, filter, add fields to the gird, save and load views, export the list of hierarchies and review the details of a hierarchy.
 -

Rego’s Clarity Adoption Metrics package consists of two sets of metrics: Project metrics, and Resource metrics. Project metrics measure how effectively project managers are using Clarity to manage their projects. Resource metrics measure how effectively resource managers are using Clarity to manage resources. Metrics are scored on a scale of 0 to 5, with higher scores indicating greater adoption and use. All metrics can be viewed numerically or graphically, and can be broken out by OBS. In addition, metric data can display as a 12-month rolling history to help identify trends. Project metrics can also display by lowest / highest adoption rates for a specific resource metric or all resource metrics. There is a variety of way to view the Adoption Metric data, therefore, Rego has made this simple by creating an Adoption Metrics object that contains multiple tabs. Each tab displays one or more of the Project or Resource Adoption Metrics. Based on the nature of the Metrics some tabs will allow the ability to use a pull down menu to select a specific Adoption Metric. There is also a Metrics trending view that pulls monthly snapshots of the metrics. Project metrics consist of the following: - Project Status Reporting – Measures how well PMs create and publish project status reports.
- Project Risk Adoption – Measures how well Risks are being used and managed.
- Project Issue Adoption – Measures how well Issues are being used and managed.
- Project Schedule – Measures how well PMs create tasks and keep the project schedule current.
- Project Baseline – Measures whether or not baselines exist.
- Project Zero ETC’s – Measures how well the PM assigns resources to tasks with ETCs.
- Project Past ETC’s – Measures how many improperly scheduled tasks the PM has.
- Project Milestone / Key Tasks – Measures how well PMs create and manage Milestones / Key Tasks.
- Project Schedule Variance – Measures how effectively PMs manage their schedules.
- Project Effort Variance – Measures how effectively PMs manage their project efforts.
- Project Budget Variance – Measures how effectively PMs manage budgets or cost plans.
- Project Unfilled Roles – Measures project roles with allocations that are already started or starting within the next 30 days.
- Project Data Quality – Measures how effectively PMs complete the Description, Stage, Progress, Objective, and Sponsor/Business Owner fields.
- Project Commitment – Measures the hard allocations for a project over a two week time frame.
- Resource Clarity Usage – Measures how often users log into Clarity.
- Resource Timesheet – Measures if timesheets post in a timely manner.
- Resource Allocation – Measures how well RMs keep total resource allocations within the expected range for future time periods.
- Resource Actualy Utilization – Measures how well Resource allocations match actuals.
- Resource Allocation Date in the Past – Measures how many resources are open for time entry with dates in the past.
- Resource Data Quality – Measures how well RMs complete the Resource Manager and Primary Role fields and optionally the Skill and Employment Type fields.
- Resource Commitment – Measures how much resource available time is committed to projects.
-
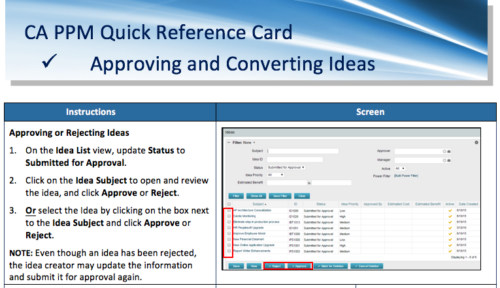 A Quick Reference Card to assist in the approving/rejecting of Ideas. Included converting Ideas once approved.
 -
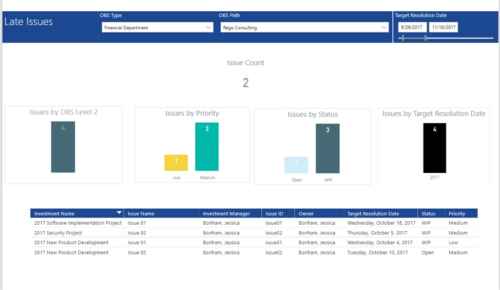 Late Issues report provides the Project Managers a single place to view all the Open Issues that are past their target resolution date. This report provides information such as Issue Count, Issues by OBS Level 2, Priority, Status and Target Resolution Date in Stacked Column Chart. In addition, this report has also Table view of Issue information such as Investment Name, Issue Name, Investment Manager, Issue ID, Owner, Target Resolution Date, Status and Priority. User can further narrow their search by OBS Type & Path and Target Resolution Date.


Copyright 2023 • Rego Consulting Corporation • Privacy Policy