-
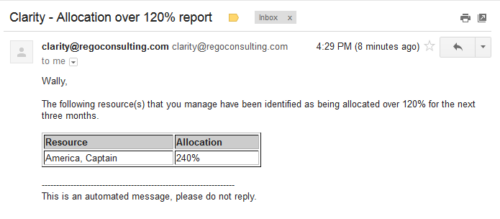 Based on the pre-determined schedule frequency, this job will send an email to Resource Managers that have a Resource meeting the criteria of: Average allocations are greater than 120% where Resource(s) and Project(s) are active over the next 90 days. This serves as a reminder to Resource Managers to monitor and manage allocations. The contents of the email include a message indicating the Resource Manager has at least one Resource meeting this criteria and a table indicating the Resource and that resource’s average, next 90 days allocations.
 -
 The Grant Team Project Edit Rights workflow allows a project manager to grant Project – Edit Management rights to all users staffed on the project. This workflow saves not only the project manager time by allowing all users on the project to update information, but also saves the administrator time from granting each resource these rights individually. The process will also remove any rights from members that have been removed from the project.
 -
 The Timesheet Approval - RM process is an auto-start process that begins once the resource submits his or her timesheet. This process provides a checks-and-balances style to ensure that all resources entering time have entered the 40 hours. Once the timesheet is submitted, the process will lock the user’s timesheet to prevent editing. The process will then select the next action based on three different factors:
- The timesheet has less than 40 hours.
- The timesheet has 40 or more hours.
- The resource’s availability is less than 8hrs/day.
-
 The Grant Booking Manager Rights to Book Resources workflow provides a resource’s Booking Manager with the rights to hard book a resource to a project. This workflow will remove unused rights, and then grant the rights needed to allow for booking of resources. The workflow also has the ability to add rights to not only the resource but also the resource manager, and resources that are assigned as proxies. If this functionality is not needed, it can easily be removed.
 -
The Grant Booking Manager Rights to Book Resources workflow provides a resource’s Booking Manager with the rights to hard book a resource to a project. This workflow will remove unused rights, and then grant the rights needed to allow for booking of resources. The workflow also has the ability to add rights to not only the resource but also the resource manager, and resources that are assigned as proxies. If this functionality is not needed, it can easily be removed.
-
 The Unlock Projects workflow process can be run through the "Execute a Process" job. The workflow will execute a query that will automatically unlock projects that have been exported / checked out for over 2 days. This prevents any projects from remaining in the “locked” state for a long period of time, preventing time from posting to these projects.
 -
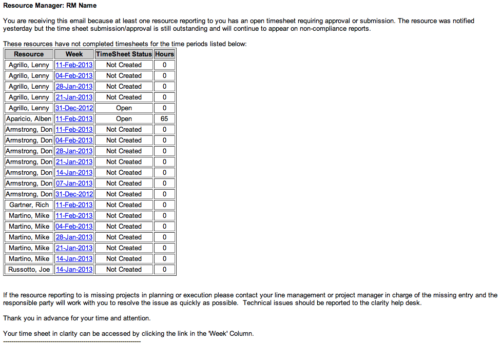 The Time Tracking Stalker - RM workflow process automatically sends an email to Resource Managers for each one of their resources that have not submitted their timesheet for a prior open time period, thus informing the RM if their resources are submitting their timesheets on time. Project Managers will also benefit since the notifications will help to ensure that time is being posted against their projects in a timely manner, helping to provide them with an accurate view of time expended on the projects.
 -
 The Self Assign workflow process updates a selected resource field on an object based on someone checking a boolean field on the same object. Using this process, whomever is editing the object, will be placed in this field automatically eliminating the need for each user to come in and update the field manually. The field will run when the Boolean is ticked and the user saves the page. It is important to note that the page will need to be reloaded to see the changes reflected. This can be used as a fast way to self-assign yourself to an object - you can create a boolean field that is checked and have the process assign you to that item.
 -
The Self Assign workflow process updates a selected resource field on an object based on someone checking a boolean field on the same object. Using this process, whomever is editing the object, will be placed in this field automatically eliminating the need for each user to come in and update the field manually. The field will run when the Boolean is ticked and the user saves the page. It is important to note that the page will need to be reloaded to see the changes reflected. This can be used as a fast way to self-assign yourself to an object - you can create a boolean field that is checked and have the process assign you to that item.
-
 The Scheduled Jobs Cleanup process removes all completed job instances that have run before a date set by the administrator. The administrator may use the gel parameter to update the amount of days since each job has run. Based on that date, the workflow will eliminate all jobs that have surpassed that threshold. This workflow helps administrators maintain the job logs and queue by eliminating jobs that users have potentially forgotten to remove on their own.
 -
The Scheduled Jobs Cleanup process removes all completed job instances that have run before a date set by the administrator. The administrator may use the gel parameter to update the amount of days since each job has run. Based on that date, the workflow will eliminate all jobs that have surpassed that threshold. This workflow helps administrators maintain the job logs and queue by eliminating jobs that users have potentially forgotten to remove on their own.
-
 The PM Stalker – Submit Status Report workflow process will email any project manager that has not submitted a status report in the last two weeks. This process will ensure that all status reports are kept up-to-date and provide management with a reliable overview of the status on the project.


Copyright 2023 • Rego Consulting Corporation • Privacy Policy