-
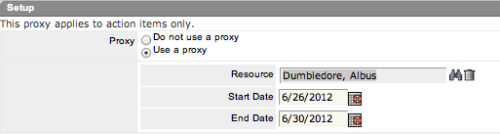 The Grant Approve Time to Proxy process utilizes the proxy feature within Clarity to assign timesheet approval and edit rights to a proxy for any resources that the user is the current resource manager for. The process, when run, will also remove any timesheet approval and edit rights for any users if the proxy has been removed or the resource manager has changed. This process is used for resource managers that will be out of the office.
 -
The Grant Approve Time to Proxy process utilizes the proxy feature within Clarity to assign timesheet approval and edit rights to a proxy for any resources that the user is the current resource manager for. The process, when run, will also remove any timesheet approval and edit rights for any users if the proxy has been removed or the resource manager has changed. This process is used for resource managers that will be out of the office.
-
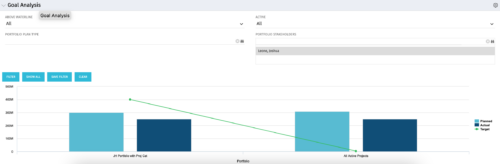 Part of our Business Transformation collection, this portlet relates exclusively to Benefit costs in the Portfolio and its investments. Portlet is a combination of Line Chart and Vertical Bar Charts. It displays data for one or more portfolios depending on rights and filters. Green Line represents Portfolio Target Benefits. Light blue bar represents aggregation of investment Planned Benefits. Dark blue bar represents aggregation of Investment Realized Benefits (actual benefits). Filtering is available for Above or Below Waterline investments OR all portfolio Investments. May also filter on Portfolio values as well as Plan values. Filtering also available for Active vs Inactive Portfolios.
 -
Part of our Business Transformation collection, this portlet relates exclusively to Benefit costs in the Portfolio and its investments. Portlet is a combination of Line Chart and Vertical Bar Charts. It displays data for one or more portfolios depending on rights and filters. Green Line represents Portfolio Target Benefits. Light blue bar represents aggregation of investment Planned Benefits. Dark blue bar represents aggregation of Investment Realized Benefits (actual benefits). Filtering is available for Above or Below Waterline investments OR all portfolio Investments. May also filter on Portfolio values as well as Plan values. Filtering also available for Active vs Inactive Portfolios.
-
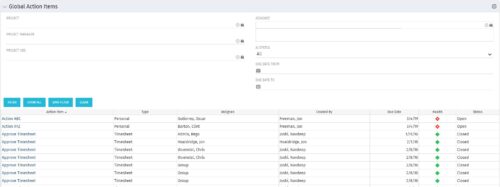 The Global Action Items portlet will help users and clarity admins to keep track of action items in the CA PPM system. This is useful to keep track of Timesheet Approval through Action Item or any other Action Item related workflows. The portlet displays Name, Type Assignee, Created by, Due Date, Health and Status of the Action Items as default columns. The portlet provides Project, Project Manager, Project OBS, Assignee, Status and Due Dates of the Action Items as default filters.
 -
The Global Action Items portlet will help users and clarity admins to keep track of action items in the CA PPM system. This is useful to keep track of Timesheet Approval through Action Item or any other Action Item related workflows. The portlet displays Name, Type Assignee, Created by, Due Date, Health and Status of the Action Items as default columns. The portlet provides Project, Project Manager, Project OBS, Assignee, Status and Due Dates of the Action Items as default filters.
-
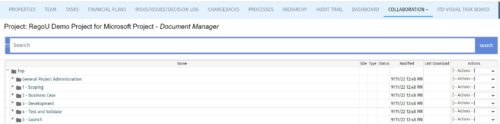 The Give PM Collaboration Manager Rights workflow process can be run through the "Execute a Process" job. The workflow will execute a query that gives a Project Manager the Collaboration Manager rights to their projects. Often times, PMs are not set as Collaboration Managers when the project is created. This script can be run to automatically give a PM the Collaboration Manager rights to their projects, without having to go through the projects one by one.
 -
The Give PM Collaboration Manager Rights workflow process can be run through the "Execute a Process" job. The workflow will execute a query that gives a Project Manager the Collaboration Manager rights to their projects. Often times, PMs are not set as Collaboration Managers when the project is created. This script can be run to automatically give a PM the Collaboration Manager rights to their projects, without having to go through the projects one by one.
-
 This quick discussion will highlight tips for ensuring you will get the most out of your Rego University experience. We will discuss how to select classes, meet with peers, and obtain one on one advice over the 3 days of the conference.


Copyright 2023 • Rego Consulting Corporation • Privacy Policy