-
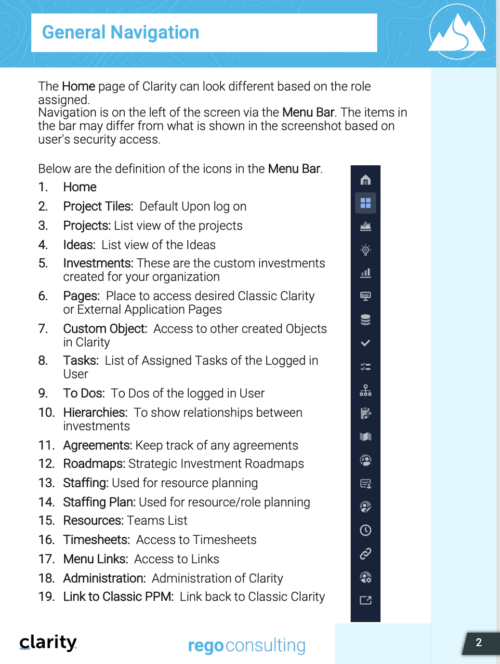
 This training document is a Rego Consulting Quick Reference Guide to assist with General Navigation in Clarity’s Modern User Experience. This doc references version 16.0 views. Doc reviews the Menu Bar and User Tool Bar.
 -
 Have you never used GEL within Clarity? This class will teach you the basics of leveraging GEL within your workflow process. It’s one of the most powerful and underutilized capabilities in Clarity for updating objects, sending emails, and XOGing. This class is designed for those that have never used GEL before.
 -
 A presentation slide deck from Rego University 2022. This document is an outline used in class for use of GEL Scripts in Clarity Development.
- Introduction
- Configuration Basics
- Security Basics
- Installing Jaspersoft Studio
- Interface Introduction
- Data Adapter Setup
- Server Connection Setup
-
 Do you have a basic understanding of GEL scripts but need to a better understanding of how they work? This class will teach you how to XOG data in and out of objects in GEL as well as perform basic emails inside GEL.
 -
 A presentation slide deck from Rego University 2022. This document is an outline used for the class on using GEL Scripts in Clarity development.
- XML Manipulation
- SOAP Web Services (XOG)
- Code Reuse
- Best Practices
-
 Are you ready to take your GEL scripting skills to the next level? This class will teach you how to leverage Java within GEL, manipulate or produce flat files, and handle errors effectively.
 -
 A presentation slide deck from Rego University 2022. Document used in Broadcom’s presentation on Value Steam Metrics.
- Steering the Business with Metrics
- Executive Strategy
- Metrics Approach
-
 Funnel Chart displays aggregated counts of Ideas by “Idea Progress”, a custom attribute. Chart shows Idea Progress names in legend, and count total is available as a mouse-over. No filters available on this portlet.
 -
Funnel Chart displays aggregated counts of Ideas by “Idea Progress”, a custom attribute. Chart shows Idea Progress names in legend, and count total is available as a mouse-over. No filters available on this portlet.
-
Funnel Chart displays aggregated counts of Ideas by “Idea Progress”, a custom attribute. Chart shows Idea Progress names in legend, and count total is available as a mouse-over. No filters available on this portlet.
-
 So, you have the portlet xogged in, what now? This guide will show you how to create a page, add the portlet to the page, and add the page to the menu. This activity requires the appropriated admin rights to add content to CA PPM.


Copyright 2023 • Rego Consulting Corporation • Privacy Policy