-

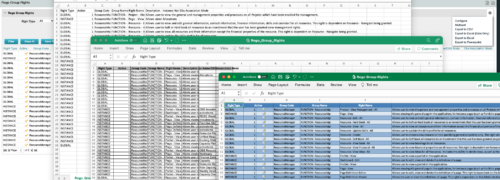
 The Rego Group Rights portlet is a useful list view for functional administrators. It provides a flat view of all the Global, OBS and Instance rights that have been granted to all the groups in Clarity. It can be further filtered by just the rights type and/or the security group. It is also possible to export out to file in spreadsheet (csv, xlsx) or PowerPoint formats with OOB Clarity functionality.
 -
 The Grant Team Project Edit Rights workflow allows a project manager to grant Project – Edit Management rights to all users staffed on the project. This workflow saves not only the project manager time by allowing all users on the project to update information, but also saves the administrator time from granting each resource these rights individually. The process will also remove any rights from members that have been removed from the project.
 -
 The Grant Team Project Edit Rights workflow allows a project manager to grant Project – Edit Management rights to all users staffed on the project. This workflow saves not only the project manager time by allowing all users on the project to update information, but also saves the administrator time from granting each resource these rights individually. The process will also remove any rights from members that have been removed from the project.
 -
 The Grant Team Project Edit Rights workflow allows a project manager to grant Project – Edit Management rights to all users staffed on the project. This workflow saves not only the project manager time by allowing all users on the project to update information, but also saves the administrator time from granting each resource these rights individually. The process will also remove any rights from members that have been removed from the project.
 -
 The Grant RM Timesheet Edit Rights workflow process can be run through the "Execute a Process" job. The workflow will execute a query that gives a Resource Manager Timesheet Edit rights for their resources. Timesheet Edit rights are not inherent for Resource Managers when they are named as an individual’s resource manager.
 -
 The Grant RM Timesheet Edit Rights workflow process can be run through the "Execute a Process" job. The workflow will execute a query that gives a Resource Manager Timesheet Edit rights for their resources. Timesheet Edit rights are not inherent for Resource Managers when they are named as an individual’s resource manager.
 -
 The Grant RM Timesheet Edit Rights workflow process can be run through the "Execute a Process" job. The workflow will execute a query that gives a Resource Manager Timesheet Edit rights for their resources. Timesheet Edit rights are not inherent for Resource Managers when they are named as an individual’s resource manager.
 -
 The Give RM Calendar & Time Rights workflow process can be run through the "Execute a Process" job. The workflow will execute a query that gives a Resource Manager Calendar Edit and Timesheet Edit rights for their resources. These rights are not inherent for Resource Managers when they are named as an individual’s resource manager.
 -
 The Give RM Calendar & Time Rights workflow process can be run through the "Execute a Process" job. The workflow will execute a query that gives a Resource Manager Calendar Edit and Timesheet Edit rights for their resources. These rights are not inherent for Resource Managers when they are named as an individual’s resource manager.
 -
 The Give RM Calendar & Time Rights workflow process can be run through the "Execute a Process" job. The workflow will execute a query that gives a Resource Manager Calendar Edit and Timesheet Edit rights for their resources. These rights are not inherent for Resource Managers when they are named as an individual’s resource manager.

