-
 Rego’s training deck for Project Management in Clarity using the Classic UX and the Phoenix theme. Reviews the OBS, WBS, Templates, Terms, Allocation vs ETC and more.
 -

 Pie Chart displays projects by Baseline Finish Variance—is current project finish beyond baseline finish; or is current project finish on or before baseline finish. Filterable by OBS structure and Finish Date range. Data labels show percent within baseline vs percent outside baseline. Mouse-over shows Within or Outside label and percent of total projects. Legend shows color coded Within Baseline and Outside Baseline labels. Drilldown: Clicking on a pie slice yields a grid portlet of projects either Within or Outside Baseline.
 -
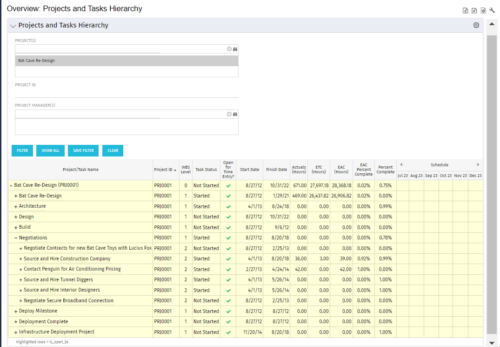 This document provides an overview of how hierarchical portlets can be exported to MS Excel. The code of a sample hierarchical portlet is explained. The included sample portlet shows a list of projects and the tasks under each project along with actual and assignment hours. The portlet can also be filtered by project and project manager.
 -
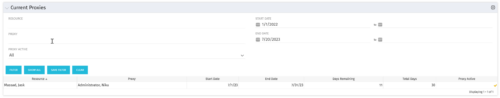 The Current Proxies portlet provides a user with an overview of all the resources in the system currently using a proxy. This portlet is helpful to determine a proxy if a user is currently out of the office. The portlet provides several pieces of information related to the resource including: resource names, proxy, start date, end date, days remaining, total days, and if the proxy is active. The user may filter by resource name, proxy name, proxy status (defaults to Yes), and start/end dates (defaults to the current date).
 -
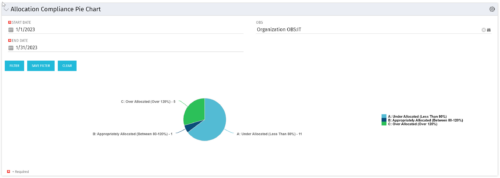 The Allocation Compliance Pie Chart portlet gives a view of active resources' allocation compliance within a date range and OBS displayed in a pie chart. It allows the user to the percentage of resources over, under, and adequately staffed on projects over a selected time period. This portlet leverages the daily allocation and daily availability slices as well as only active investments. The portlet provides filters for specific dates (required) and OBS.
 -
 A presentation slide deck from Rego University 2022. This course was a review of the power of perception and how to improve on the adoption of Apptio.
- The Perception of Apptio
- The Perception of Adoption
- Driving Adoption
- Measuring Success
-
 A presentation slide deck from Rego University 2022. A review of the best practices in IT Planning from an Apptio perspective.
- Custom layouts
- Bookmarks
- Dropdown and autofill
- Cost object permissions
- Dashboard reports
- Targets
- Change history / Event Log
- Data input enforcement
- Managing archive
- Stay on top of product updates
-
 A presentation slide deck from Rego University 2022. This course reviewed the value of a strategic roadmap for TBM.
- Defining the Value of a Strategic Roadmap
- Roadmapping Methodology
- Best Practices
- TBM Roadmap Examples
-
 Are you struggling with implementing Agile tools in your organization in addition to CA PPM? This class will review best practices for implementing agile tools in conjunction with CA PPM - living in a Bi-Modal world. We will discuss how CA PPM can be used to govern both types of work and teams and how Agile tools should interface into CA PPM.
 -
 Maximize the value of your training delivery by increasing end user engagement with the course content. Discuss options to optimize efficiency and help ensure users are engaged while participating in training.
 -
 Are you ready to go beyond simple graph and grid portlets? This class will show you how to create and export portlets with hierarchical structure and drill-down capability, and includes examples of advanced portlets and complex queries.
 -
 Have you ever experienced the downside of metrics? This class is a working session that review different types of metrics and the problems they uncover as well as the problems they can cause. Learn how to balance your positive and negative metric impacts.


Copyright 2023 • Rego Consulting Corporation • Privacy Policy