-
 The Capacity Planning by Role and Skill portlet displays all availability and demand in the system summarized by role. The portlet also allows the user to drill-down further into the role and separate the hours by primary skill. This portlet leverages the timeslices, and pulls availability from resources and allocation from the team records. The user is able to narrow the results by filtering on start/finish date, time period, active projects, and active resources. Using this portlet, a resource manager can quickly determine resource needs, skill needs, and overall allocation/availability of roles.
 -
 The Communications Portlet - Simple portlet provides a simple mechanism to communicate with Clarity users. The content of the porlet can be edited easily through the Portlet administration screens within Clarity. This is a very beneficial method of delivering messages to your Clarity users all at the same time.
 -

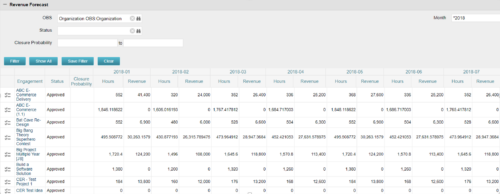
The Revenue Forecast portlet displays projected revenue at a project level broken out by month. This portlet assists in viewing all project revenue data at once and making it easily exportable. The table below describes the available filter fields in the portlet. Column Label Description OBS OBS to filter projects with Status Status of the project Closure Probability ? Months Month(s) of Project Revenue to display -

The Revenue Forecast portlet displays projected revenue at a project level broken out by month. This portlet assists in viewing all project revenue data at once and making it easily exportable. The table below describes the available filter fields in the portlet. Column Label Description OBS OBS to filter projects with Status Status of the project Closure Probability ? Months Month(s) of Project Revenue to display


