-
 The Projects by Stage and Manager portlet displays all active projects (excluding programs), with a project stage and project manager. The portlet color codes the different stages that and counts the number of projects in each stage by project manager. This portlet provides a quick snapshot of all projects with stage details so the PMO may get an overview of where certain projects are sitting with each Project Manager.
 -
The Projects by Stage and Manager portlet displays all active projects (excluding programs), with a project stage and project manager. The portlet color codes the different stages that and counts the number of projects in each stage by project manager. This portlet provides a quick snapshot of all projects with stage details so the PMO may get an overview of where certain projects are sitting with each Project Manager.
-
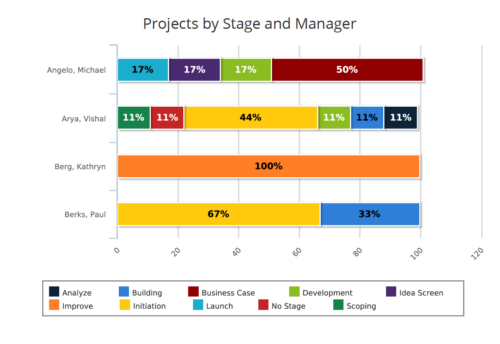 Projects by Stage and Manager report is a stacked bar chart that displays percentage of projects associated with project manager at a particular stage. Legend displays colors used to represent various Project Stages. This report provides to PMO a quick snapshot of where certain projects are sitting with each Project Manager. You can further narrow your search by Project Manager, Project Name, Is Project Active? , Is Template? And Is Program?
 -
 Pie Chart displays counts of all projects by out-of-box Status Indicator attributes. Filterable by OBS structure and Manager. Data label displays count. Mouse-over and Legend display Indicator name. Chart also displays count for projects with no Indicator.
 -
Pie Chart displays counts of all projects by out-of-box Status Indicator attributes. Filterable by OBS structure and Manager. Data label displays count. Mouse-over and Legend display Indicator name. Chart also displays count for projects with no Indicator.
-
Pie Chart displays counts of all projects by out-of-box Status Indicator attributes. Filterable by OBS structure and Manager. Data label displays count. Mouse-over and Legend display Indicator name. Chart also displays count for projects with no Indicator.
-
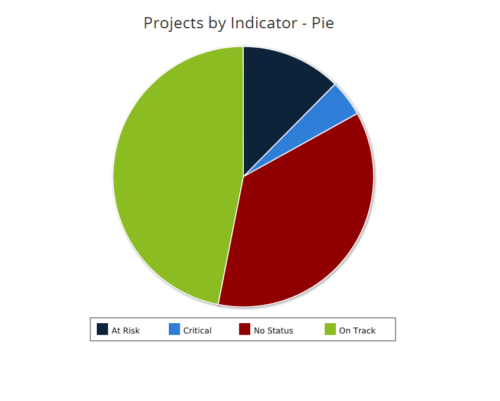 Projects by Status Indicator is a pie chart that displays count of projects by out of box Status Indicator attribute. Legend displays the colors associated with various Status Indicator values. Mouse over the pie chart slice displays the count of projects associated with that respective Status Indicator value. You can further narrow your search by OBS Path, Project Manager and Is Project Active?.
 -

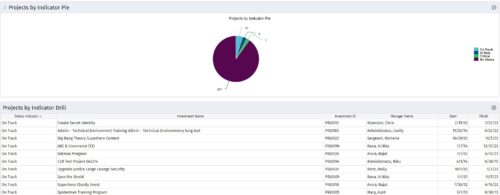 Pie Chart displays counts of all projects by out-of-box Status Indicator attribute. Filterable by OBS structure and Manager. Data label displays count. Mouse-over and Legend display Indicator name. Chart also displays count for projects with no Indicator. By clicking on a pie slice, a grid portlet appears displaying all projects with that indicator value.
 -
Pie Chart displays counts of all projects by out-of-box Status Indicator attribute. Filterable by OBS structure and Manager. Data label displays count. Mouse-over and Legend display Indicator name. Chart also displays count for projects with no Indicator. By clicking on a pie slice, a grid portlet appears displaying all projects with that indicator value.
-
 The Projects Marked for Deletion portlet displays information about projects that are currently pending deletion but excludes templates and programs. This portlet provides an easy way to view all projects that are marked for deletion before the background job actually erases them. The portlet provides all necessary information as well as the project manager in case there are questions about why the project was marked for deletion.
 -
The Projects Marked for Deletion portlet displays information about projects that are currently pending deletion but excludes templates and programs. This portlet provides an easy way to view all projects that are marked for deletion before the background job actually erases them. The portlet provides all necessary information as well as the project manager in case there are questions about why the project was marked for deletion.


Copyright 2023 • Rego Consulting Corporation • Privacy Policy