-
 This training document is a Rego Consulting Quick Reference Guide to assist with use of the Common Grid. You can find the grid throughout the application to manage projects, tasks, roadmaps, ideas, and timesheets to name a few. The QRG reviews View Options, Column Adjustments, the Details Panel and more.
 -

Rego’s Clarity Adoption Metrics package consists of two sets of metrics: Project metrics, and Resource metrics. Project metrics measure how effectively project managers are using Clarity to manage their projects. Resource metrics measure how effectively resource managers are using Clarity to manage resources. Metrics are scored on a scale of 0 to 5, with higher scores indicating greater adoption and use. All metrics can be viewed numerically or graphically, and can be broken out by OBS. In addition, metric data can display as a 12-month rolling history to help identify trends. Project metrics can also display by lowest / highest adoption rates for a specific resource metric or all resource metrics. There is a variety of way to view the Adoption Metric data, therefore, Rego has made this simple by creating an Adoption Metrics object that contains multiple tabs. Each tab displays one or more of the Project or Resource Adoption Metrics. Based on the nature of the Metrics some tabs will allow the ability to use a pull down menu to select a specific Adoption Metric. There is also a Metrics trending view that pulls monthly snapshots of the metrics. Project metrics consist of the following: - Project Status Reporting – Measures how well PMs create and publish project status reports.
- Project Risk Adoption – Measures how well Risks are being used and managed.
- Project Issue Adoption – Measures how well Issues are being used and managed.
- Project Schedule – Measures how well PMs create tasks and keep the project schedule current.
- Project Baseline – Measures whether or not baselines exist.
- Project Zero ETC’s – Measures how well the PM assigns resources to tasks with ETCs.
- Project Past ETC’s – Measures how many improperly scheduled tasks the PM has.
- Project Milestone / Key Tasks – Measures how well PMs create and manage Milestones / Key Tasks.
- Project Schedule Variance – Measures how effectively PMs manage their schedules.
- Project Effort Variance – Measures how effectively PMs manage their project efforts.
- Project Budget Variance – Measures how effectively PMs manage budgets or cost plans.
- Project Unfilled Roles – Measures project roles with allocations that are already started or starting within the next 30 days.
- Project Data Quality – Measures how effectively PMs complete the Description, Stage, Progress, Objective, and Sponsor/Business Owner fields.
- Project Commitment – Measures the hard allocations for a project over a two week time frame.
- Resource Clarity Usage – Measures how often users log into Clarity.
- Resource Timesheet – Measures if timesheets post in a timely manner.
- Resource Allocation – Measures how well RMs keep total resource allocations within the expected range for future time periods.
- Resource Actualy Utilization – Measures how well Resource allocations match actuals.
- Resource Allocation Date in the Past – Measures how many resources are open for time entry with dates in the past.
- Resource Data Quality – Measures how well RMs complete the Resource Manager and Primary Role fields and optionally the Skill and Employment Type fields.
- Resource Commitment – Measures how much resource available time is committed to projects.
-
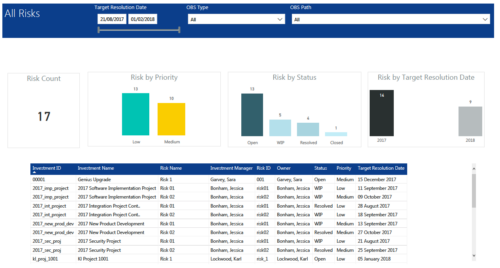 All Risks report provides project managers a single place to view KPIs related to Risks. All the KPIs are depicted in various visualizations. Risk Count: Scorecard that displays the # of Risks for the selected criteria. Risk Priority: Column chart that displays # of Risks by Priority. X axis displays various Risk Priorities. Data labels indicate the number of Risks associated with that category. Risk by Status: Column chart that displays # of Risks by Status. X axis displays various Risk statuses. Data labels indicate the number of Risks associated with that status. Risk by Target Resolution Date: Column chart that displays # of Risks by year of Target Resolution Date. X axis displays Year. Data labels indicate the number of Risks associated with that category. Grid: Displays Risk details such as Investment ID, Investment Name, Investment Manager, Risk ID, Risk Name, Owner, Status, Priority and Target Resolution Date. You can further narrow your search by OBS Type, OBS Path and Target Resolution Date range.
 -
 A presentation slide deck from Rego University 2021. This course covered enabling the Modern UX and timesheets, creating a link to the MUX in the classic home menu, creating Blueprints and more.
 -
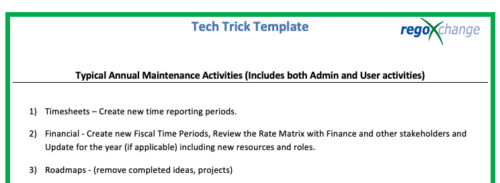 This is a list of 12 typical maintenance items that should be completed for Clarity on an annual basis. There is also a short list of items that should be completed periodically depending on client policies.
 -
 A slide deck used in Rego’s training sessions around Financials, in Clarity’s modern UX. The slides cover the Value of Financial Management, Core Financial Components, Investment Financial Attributes, the Rate Matrix, Cost/Budget/Benefit Plans, Actual Costs, Integrations, and Best Practices.
 -
 A Quick Reference Guide to assist in the use of Blueprints/Channels to access external sites, applications or Classic PPM in the Modern UX of Clarity. Reviews the configuraton process.
 -
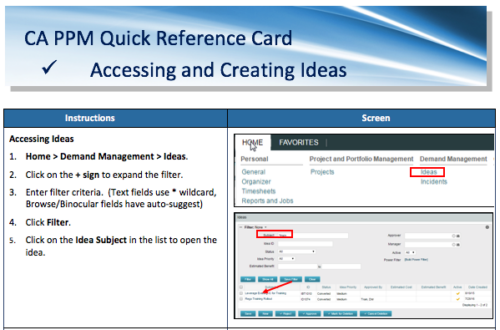 A Quick Reference Card to assist in the creation of Ideas in CA PPM. Ideas are created by going to Home, then Demand Management and choosing Ideas from the list menu.
 -
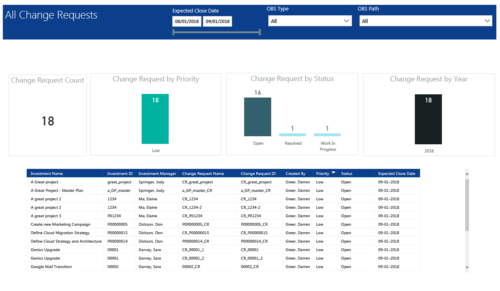 All Change Requests report provides project managers a single place to view KPIs related to Change Requests. All the KPIs are depicted in various visualizations. Change Request Count: Scorecard that displays the # of Change Requests for the selected criteria. Change Request by Priority: Column chart that displays # of Change Request by Priority. X axis displays various Change Request priority. Data labels indicate the number of Change Request associated with that category. Change Request Status: Column chart that displays # of Change Request by Status. X axis displays various Status. Data labels indicate the number of Change Request associated with that Status. Grid: Displays Change Request details such as Investment ID, Investment Name, Investment Manager, Change Request ID, Change Request Name, Status, Priority and Expected Close Date. You can further narrow your search by Expected Close Date Range, OBS Type and OBS Path.
 -
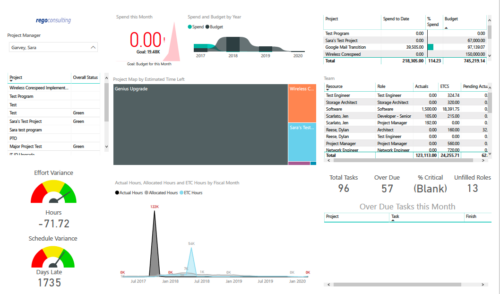 Project Health by PM is a dashboard that contains multiple visualizations showing various KPIs of projects managed by a project manager. Dashboard shows KPIs like summary of Over Due tasks, Critical tasks, Unfilled roles on Project, Effort and Schedule variance etc. Spend this month – Area graph that shows Actual vs Budget cost for current month. Spend and Budget by Year – Ribbon chart that shows yearly distribution of Actual vs Budget cost. Project Map by Estimated time left – Tree map representing ETC hours remaining on each project. Team – Grid section that shows list of team members with respective Actuals and ETC hours. Actual Hours, Allocated Hours and ETC Hours by Fiscal Month – Area graph that shows monthly distribution of Actuals vs Allocation vs ETC.
 -
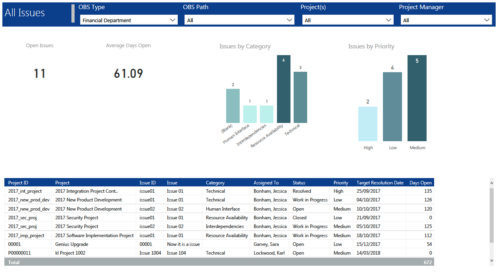 All Issues report provides project managers a single place to view KPIs related to Issues. All the KPIs are depicted in various visualizations. Open Issues: Scorecard that displays the # of Issues that are not closed or resolved. Average Days Open: Scorecard that displays the # of days on an average an issue is in open state. Issue category: Column chart that displays # of Issues by category. X axis displays various Issue categories. Data labels indicate the number of Issues associated with that category. Issue Priority: Column chart that displays # of Issues by priority. X axis displays various Issue priority. Data labels indicate the number of Issues associated with that priority. Grid: Displays Issue details such as Project ID, Project, Issue ID, Issue, Category, Assigned To, Status, Priority, Target Resolution Date and Days Open. You can further narrow your search by OBS Type, OBS Path, Project(s) and Project Manager.
 -
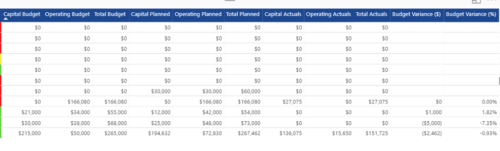
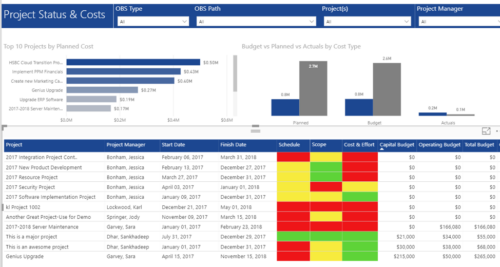 Project Status and Costs report has the details of the Project Schedule, Scope, Cost and Effort Statuses along with Planned, Budget & Actuals costs. There is also graphical representation that shows Top 10 projects by Planned Cost, Budget vs Planned vs Actuals by Cost Type. User can further narrow their search by OBS Type & Path, Project(s) and Project Manager.


Copyright 2023 • Rego Consulting Corporation • Privacy Policy