-
 Course Description: Have you considered using Rally Software® in conjunction with Clarity PPM? Have you seen or heard about the OOTB connector? This class will go through the OOTB connector in detail and show how Rego has built addons to enhance the connectivity between these two tools.
 -
 The Timesheet Notes portlet displays all timesheet notes split out by resource, investment and task. This is very useful in situations where you want to review multiple notes as you do not have to open each note separately. The table below describes the available filter fields in the portlet.
Column Label Description Timesheet Period Start Range of time periods to display filtered by start date Timesheet Period Finish Range of time periods to display filtered by finish date Resource Resource(s) to display Type Note on a timesheet or time entry (task specific) -
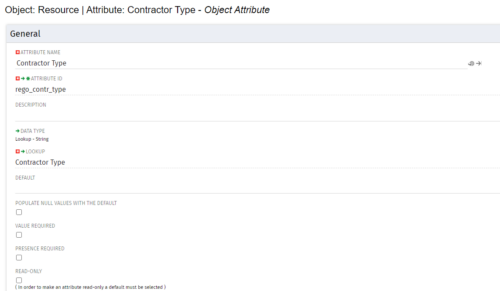
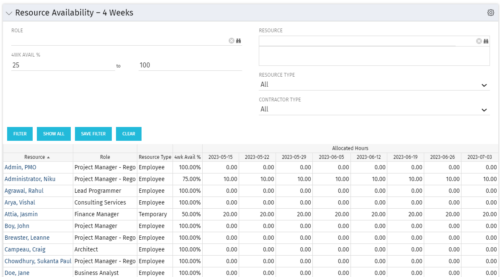 Resource Availability – 4 Weeks is a grid portlet that displays all resources with their total allocated hours by week, and an average availability percent (4 Wk Avail %) for next four weeks. If % Available is negative, this indicates an over-allocation. Zero% Average Availability indicates fully allocated (no remaining availability). Filterable by Role, Resource, Resource Type, Full-Time/Part-Time, Availability Range. Contractor Type is a custom attribute (Lookup - String) created on the Resource object. It is attached to the lookup, Contractor Type (Lookup ID: REGO_CONTRACTOR_TYPE) that has static values Part Time (PT) and Full Time(FT).
 -
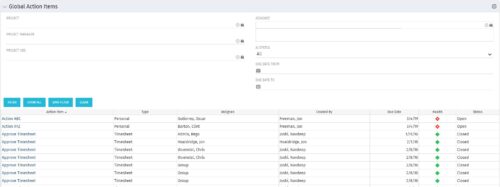 The Global Action Items portlet will help users and clarity admins to keep track of action items in the CA PPM system. This is useful to keep track of Timesheet Approval through Action Item or any other Action Item related workflows. The portlet displays Name, Type Assignee, Created by, Due Date, Health and Status of the Action Items as default columns. The portlet provides Project, Project Manager, Project OBS, Assignee, Status and Due Dates of the Action Items as default filters.
 -
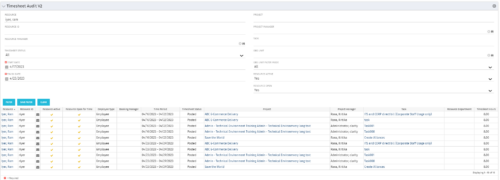 The Timesheet Audit portlet displays timesheet information in order to perform an audit. The only required data needed to search the portlet is start and finish date. Additionally, you may narrow the results by filtering by resource, resource ID, OBS Unit, resource manager, timesheet status, project, and task. The portlet provides reporting on the following:
- Resource
- Resource ID
- Email Icon of Resource (So the reviewer can quickly email the Resource)
- Resource is Active
- Resource Open for Time
- Time Period (Start and Finish Dates)
- Timesheet Status
- Is Adjustment (If the timesheet is adjusted)
- Timesheet Modified Date
- Timesheet Posted Date
- Timesheet Submitted By
- Timesheet Approved By
- Project
- Task
- Proposed ETC Hours
- Pending Actual Hours
- Total Actual Hours
-
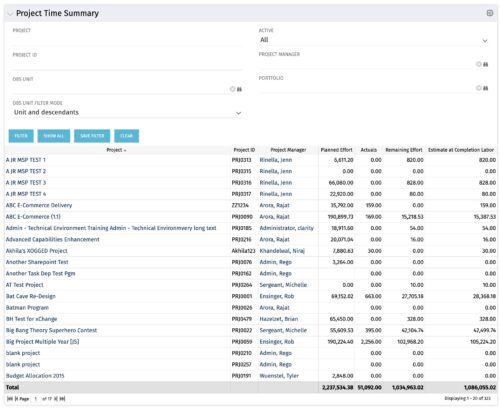 Project managers may use this portlet to show the planned effort and the remaining effort on projects. Includes actual hours as well as estimate at completion. You may narrow the results by filtering by project name, project manager, project OBS, or active flag. The portlet will display each project by ID, name, project manager, planned effort (total allocation hours), actual hours, remaining effort (ETC), and estimate at complete (actual + ETC).
 -
 The My Resource Vacation portlet allows a resource to view the current logged in users' annual vacation allowance, as set by the resource manager, against the resource vacation calendar hours and actual posted timesheet hours. The portlet is useful for determining the amount of hours a resource has requested off and has remaining. The portlet also ensures the resource has accounted for all annual vacation allowance hours in the calendar and has posted time for all past calendar request hours.
 -
 The Hours and Cost by Vendor – Grid portlet displays vendor hour or costs by month grouped by vendor. Using this portlet, management is provided with a quick overview of vendor costs or hours by month for a set of time without running a report or navigating to each resource individually. This portlet uses the monthly actual timeslices. The user may filter by vendor, vendor ID, date, and hours/cost in addition to the start/finish and hours/cost. Once populated, the grid will display all vendors that currently have hours/cost for the selected time frame.
 -
 The Hours and Cost by Vendor - Graph portlet displays vendor hour or costs by month. Using this portlet, management is provided with a graphical representation of vendor costs or hours by month for a set of time without running a report or navigating to each resource individually. This portlet uses the monthly actual timeslices. Additionally, the user must select a date range and whether to display hours or costs. Once populated, the graph will display all vendors that currently have hours and cost for the selected date range.
 -
The Hours and Cost by Vendor - Graph portlet displays vendor hour or costs by month. Using this portlet, management is provided with a graphical representation of vendor costs or hours by month for a set of time without running a report or navigating to each resource individually. This portlet uses the monthly actual timeslices. Additionally, the user must select a date range and whether to display hours or costs. Once populated, the graph will display all vendors that currently have hours and cost for the selected date range.
-
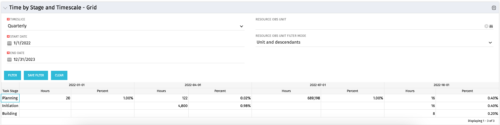 The Time by Stage and Timescale – Grid portlet displays hours for all tasks on projects by their stage for a user-defined time period. The user may narrow the results by time scale, resource OBS unit, and dates. The portlet not only provides the total hours per stage, but also the percentage of time spent on each task type. This portlet pulls data from the timeslices. Using this portlet, management can determine if excess time is being spent on a certain task stage within a project.
 -
 The Time By Type - Pie Chart portlet is a graphical representation of time by type of investment for all resources the logged in user has security rights to view. This portlet pulls from the daily timeslices, and can be used for determining what types of projects receive the majority of hours. The filter option allows for entry of a specific start date and finish date.


Copyright 2023 • Rego Consulting Corporation • Privacy Policy