
199 results
-
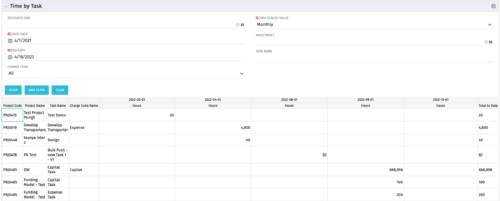 The Time by Task portlet displays time logged to tasks for all investments the logged in user has security rights to view - pulling data from the timeslices. It is capable of displaying the data by weekly, monthly, quarterly or annually segments. The portlet may also be filtered by investment and resource OBS.
 -
The Time by Task portlet displays time logged to tasks for all investments the logged in user has security rights to view - pulling data from the timeslices. It is capable of displaying the data by weekly, monthly, quarterly or annually segments. The portlet may also be filtered by investment and resource OBS.
-
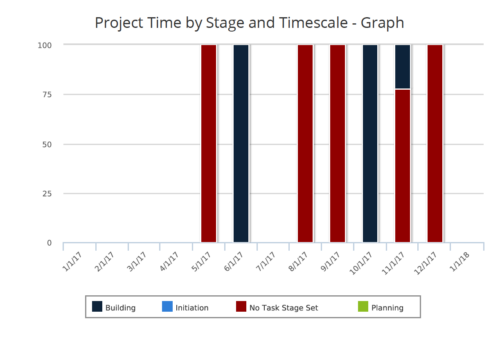 Time by Stage and Timescale – Graph report is a stacked column chart that displays hours for all tasks on projects by their stage for a user-defined time period. Using this report, Management can determine if excess time is being spent on a certain task stage within a project You can further narrow your search by Month Start Date, OBS Type & Path, Is Project Active? And Is Template?
 -
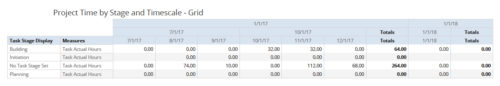 Time by Stage and Timescale – Grid report displays hours for all tasks on projects by their stage for a user-defined time period. Information can be drilled down to Year, Quarter or Monthly level. Using this report, Management can determine if excess time is being spent on a certain task stage within a project You can further narrow your search by Month Start Date, OBS Type & Path, Is Project Active? And Is Template?
 -
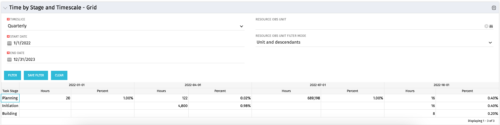 The Time by Stage and Timescale – Grid portlet displays hours for all tasks on projects by their stage for a user-defined time period. The user may narrow the results by time scale, resource OBS unit, and dates. The portlet not only provides the total hours per stage, but also the percentage of time spent on each task type. This portlet pulls data from the timeslices. Using this portlet, management can determine if excess time is being spent on a certain task stage within a project.
 -
The Time by Stage and Timescale – Grid portlet displays hours for all tasks on projects by their stage for a user-defined time period. The user may narrow the results by time scale, resource OBS unit, and dates. The portlet not only provides the total hours per stage, but also the percentage of time spent on each task type. This portlet pulls data from the timeslices. Using this portlet, management can determine if excess time is being spent on a certain task stage within a project.
-
 The Time by Stage and Timescale – Graph portlet displays a graphical representation of hours for all tasks, by stage, for a user-defined time period on projects. The user may filter the results on: Time Scale, Resource OBS Unit, and Date Range. This portlet pulls data from the timeslices. Using this portlet, management can determine if excess time is being spent on certain task stages within projects.
 -
The Time by Stage and Timescale – Graph portlet displays a graphical representation of hours for all tasks, by stage, for a user-defined time period on projects. The user may filter the results on: Time Scale, Resource OBS Unit, and Date Range. This portlet pulls data from the timeslices. Using this portlet, management can determine if excess time is being spent on certain task stages within projects.
-
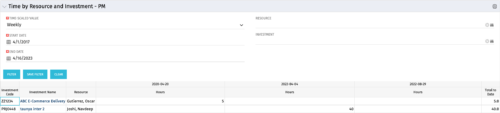 The Time By Resource and Investment - PM portlet shows time spent on projects where the logged in user is the project manager. This portlet is used to get a snapshot of investments and the time that has been put against them at the individual resource level for the projects that user has access to. This portlet is used for determining what resources have put time against specific investments and can be used to see where resources are spending their time or to help rationalize ETCs for remaining work for planning purposes. The portlet may be filtered by time-scale, date, resource or investment to narrow the search results.
