-
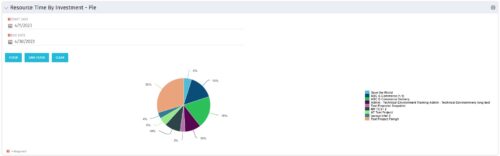 The Resource Time by Investment - Pie portlet shows a graphical representation of the time spent on investments for all resources where the logged in user is selected as the resource manager. The portlet gives the Resource Manager the ability to quickly view all time reported by resources against projects. The portlet filters between specific dates using the daily actuals timeslice. The pie chart provides a graphical view as to how time is divided across projects.
 -
The Resource Time by Investment - Pie portlet shows a graphical representation of the time spent on investments for all resources where the logged in user is selected as the resource manager. The portlet gives the Resource Manager the ability to quickly view all time reported by resources against projects. The portlet filters between specific dates using the daily actuals timeslice. The pie chart provides a graphical view as to how time is divided across projects.
-
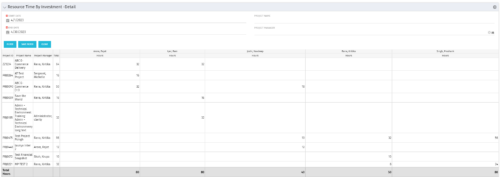 The Resource Time by Investment Detail portlet gives the Resource Manager the ability to search for time reported by resources against investments. The portlet provides filters for specific dates, a particular project and/or Project Manager. Using this portlet, the RM can get an overview of all data in a time period, the overall time logged to a project and the breakdown of his or her resources’ hours on that project.
 -
The Resource Time by Investment Detail portlet gives the Resource Manager the ability to search for time reported by resources against investments. The portlet provides filters for specific dates, a particular project and/or Project Manager. Using this portlet, the RM can get an overview of all data in a time period, the overall time logged to a project and the breakdown of his or her resources’ hours on that project.
-
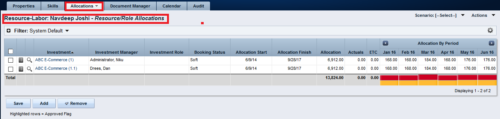
 This portlet displays the % allocation of resources to projects. The portlet shows if the resource is allocated to the projects as an individual resource or as part of an Agile team, in which case it will display the resource % allocation to the team and what that will represent in terms of % allocation to the project. The Total Allocation % display the allocation of the resource to all investments is allocated to. Remaining Capacity and Over/Under columns will help identify the resources that still have availability and the ones that are over allocated.
 -
This portlet displays the % allocation of resources to projects. The portlet shows if the resource is allocated to the projects as an individual resource or as part of an Agile team, in which case it will display the resource % allocation to the team and what that will represent in terms of % allocation to the project. The Total Allocation % display the allocation of the resource to all investments is allocated to. Remaining Capacity and Over/Under columns will help identify the resources that still have availability and the ones that are over allocated.
-
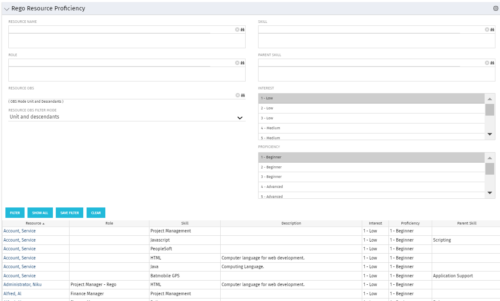 This grid displays Skill Proficiency and Interest Level by Resource. Users can utilize this view to search for Resources by Skill, Parent Skill, Interest, Role, Parent Role, Resource and Resource OBS. This portlet grants a Project Manager or Resource Manager the ability to determine which Resources best fit the needs for their project.
 -
This grid displays Skill Proficiency and Interest Level by Resource. Users can utilize this view to search for Resources by Skill, Parent Skill, Interest, Role, Parent Role, Resource and Resource OBS. This portlet grants a Project Manager or Resource Manager the ability to determine which Resources best fit the needs for their project.
-
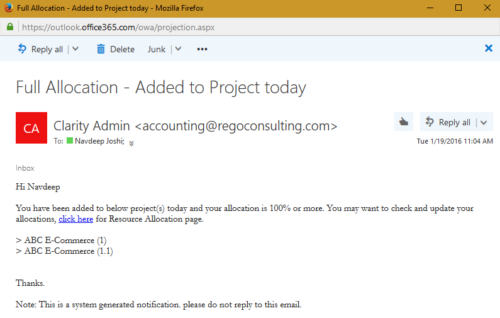 The process notifies resource who has been added to investment today and allocation is greater or equal to 100%. The process is on-demand and would require the user to have appropriate rights to run the process. Process should be scheduled as daily once job.
 -
The process notifies resource who has been added to investment today and allocation is greater or equal to 100%. The process is on-demand and would require the user to have appropriate rights to run the process. Process should be scheduled as daily once job.
-
The process notifies resource who has been added to investment today and allocation is greater or equal to 100%. The process is on-demand and would require the user to have appropriate rights to run the process. Process should be scheduled as daily once job.
-

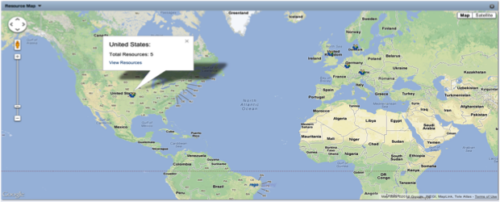 The Resource Map portlet is designed to display resource counts, by country, on a map of the world. Clicking one of the resource markers on the map will display the total resource count for that country. Additionally, a link is provided that connects to a grid portlet which displays all resources that reside in that country. The ability to zoom in and out on areas of the world is available. Due to the requirements outlined in the Special Installation Instructions section, this portlet requires 2-3 Rego Consulting hours to install. Further customization of the data on this map and its associated grid portlet may be requested. Please contact us for more details.
 -
 Course Description: This class will provide a list of daily and weekly activities that every resource manager should follow to leverage Clarity PPM more effectively.
 -
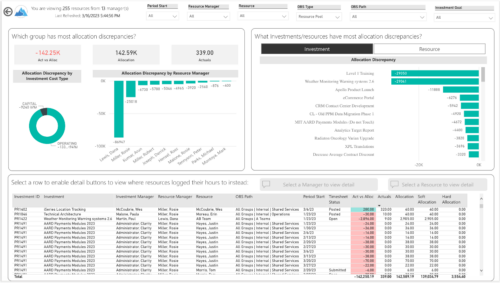
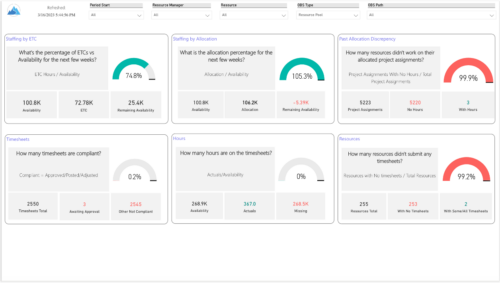
 Evaluate resource allocations, identify bottlenecks, and ensure optimal resource utilization across projects and teams. Report Views include:
- Allocation Discrepancies
- Resource Detail
- Resource Skills
- Resource Summary
- Resource Tasks
- Staffing Allocations
- Staffing ETC
-
 Evaluate resource allocations, identify bottlenecks, and ensure optimal resource utilization across projects and teams. Report Views include: • Allocation Discrepancies • Resource Detail • Resource Skills • Resource Summary • Resource Tasks • Staffing Allocations • Staffing ETC Demo Video - https://www.youtube.com/watch?v=0Rzwl1-jbck&list=PLXJ5ktuWV0jiS9CvBpHvBIwpKPmA9uvwK&index=6
 -
 Do you want to talk to other Clarity customers that are using - or plan to use - resource management capabilities? In this moderated Round Table, attendees can share experiences and provide insights on process, configurations, challenges, and successes. We will have an expert panel and then divide into small groups to discuss customer selected topics. 100% sharing. 100% learning.
 -
 Do you want to talk to other customers that are using or plan to use demand management? In this moderated Round Table where customers can share experiences and provide insights on process, configurations, challenges, and successes. We will have an expert panel and then divide into small groups and discuss customer selected topics - 100% sharing.
 -
 Do you want to understand the OOTB configuration and functionality of resource management? In this class, we will review the OOTB objects, views, and functions of assignments, allocations, and other related areas. We will cover both classic and new UX highlighting differences.
 -
 Are you starting a resource management implementation, or do you want to compare how you are using these functions vs. others or best practices? In this class we will discuss some best practices from successful customers.
 -
 Are you starting a resource management implementation, or do you want to compare how you are using these functions vs. others or best practices? In this class we will discuss some best practices from successful customers.


Copyright 2023 • Rego Consulting Corporation • Privacy Policy