-
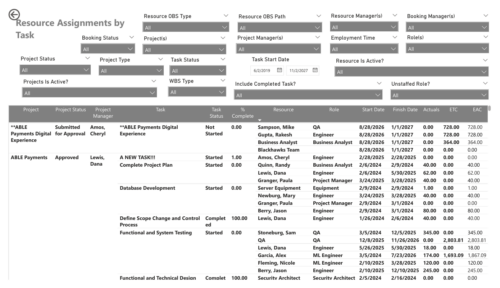 The Resource Assignments by Task report delivers a detailed view of effort distribution for resources working on investment tasks. It outlines both recorded and projected effort at the task assignment level, along with total effort per resource. In addition, the report includes key task details such as progress status, percentage of completion, and assignment start and end dates. This information helps stakeholders monitor workload distribution, track task progress, and evaluate how resource effort aligns with project expectations.
 -
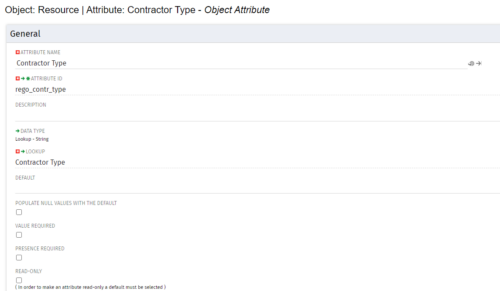
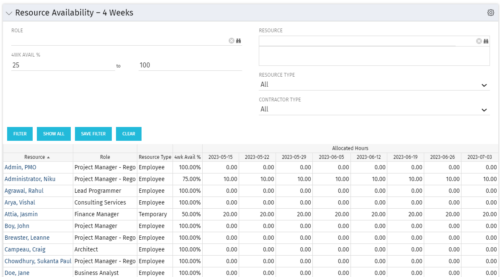 Resource Availability – 4 Weeks is a grid portlet that displays all resources with their total allocated hours by week, and an average availability percent (4 Wk Avail %) for next four weeks. If % Available is negative, this indicates an over-allocation. Zero% Average Availability indicates fully allocated (no remaining availability). Filterable by Role, Resource, Resource Type, Full-Time/Part-Time, Availability Range. Contractor Type is a custom attribute (Lookup - String) created on the Resource object. It is attached to the lookup, Contractor Type (Lookup ID: REGO_CONTRACTOR_TYPE) that has static values Part Time (PT) and Full Time(FT).
 -
Resource Availability – 4 Weeks is a grid portlet that displays all resources with their total allocated hours by week, and an average availability percent (4 Wk Avail %) for next four weeks. If % Available is negative, this indicates an over-allocation. Zero% Average Availability indicates fully allocated (no remaining availability). Filterable by Role, Resource, Resource Type, Full-Time/Part-Time, Availability Range. Contractor Type is a custom attribute (Lookup - String) created on the Resource object. It is attached to the lookup, Contractor Type (Lookup ID: REGO_CONTRACTOR_TYPE) that has static values Part Time (PT) and Full Time(FT).
-
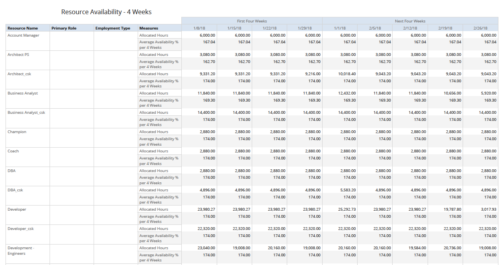 Resource Availability – 4 Weeks displays all resources with their total allocated hours by week, and an average availability percent (4 Wk Avail %) for next four weeks. This report also displays Resource Primary Role and Employment Type. User can further narrow their search by Resource Name, Resource Type & Week Start Date. User can use exact dates or relative dates for Week Start Date filter parameters.
 -
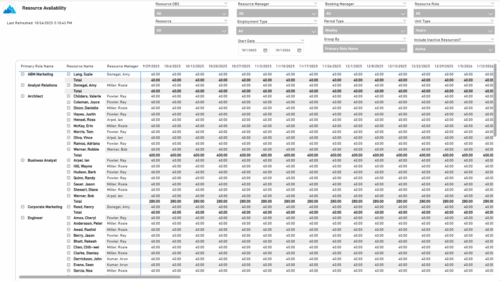 The Resource Availability report provides visibility into each resource’s available capacity across projects. It allows users to view availability by resource, grouped by either resource manager or primary role, helping identify under- or over-utilized team members. The report can display data by week, month, or in total, and amounts can be viewed in hours or full-time equivalents (FTEs).
 -
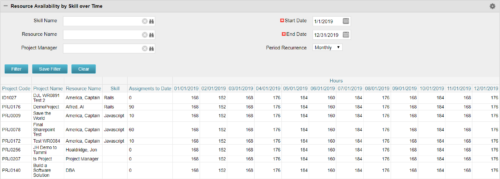 Resource Availability by Skill over Time is a grid portlet that provides Resource Managers a single place to view Resources’ skill sets along with their availability (hrs.) over a period of time. This report also displays the assigned Investments to date and the Actual hours to date for the Resource on those respective Investments. Users can further narrow their search by Skill Name, Resource Name, Project Manager, Start Date, End Date and Period Recurrence.
 -
Resource Availability by Skill over Time is a grid portlet that provides Resource Managers a single place to view Resources’ skill sets along with their availability (hrs.) over a period of time. This report also displays the assigned Investments to date and the Actual hours to date for the Resource on those respective Investments. Users can further narrow their search by Skill Name, Resource Name, Project Manager, Start Date, End Date and Period Recurrence.
-
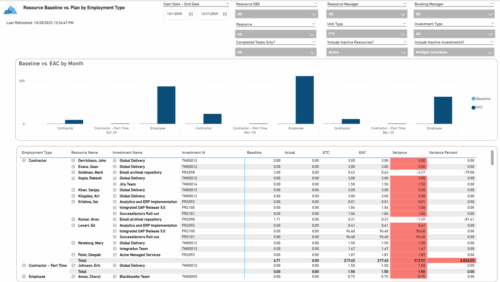 The Resource Baseline vs. Plan by Employment Type report provides insight into how resource utilization compares to the original baseline. It displays baseline, actual, estimate, and variance values for each resource across investments, grouped by employment type—such as employees or contractors. The report includes monthly charts that compare baseline amounts to estimated-at-completion values, with data shown in either hours or full-time equivalents (FTEs). This enables clear visibility into performance and variances by employment category.
 -
 The Resource Data Issues portlet is used to identify data exceptions related to resource setup. This portlet helps to identify where resources are missing key data or are possibly sitting in an exception state. This view will show resources that have one or many exceptions, including inactive resources. There is no security built into this portlet - all resources will show. The only required field in the filter is Days, which is the number of days since the user last logged in. The user may also narrow the results by resource, OBS, or project type.
 -
The Resource Data Issues portlet is used to identify data exceptions related to resource setup. This portlet helps to identify where resources are missing key data or are possibly sitting in an exception state. This view will show resources that have one or many exceptions, including inactive resources. There is no security built into this portlet - all resources will show. The only required field in the filter is Days, which is the number of days since the user last logged in. The user may also narrow the results by resource, OBS, or project type.


Copyright 2023 • Rego Consulting Corporation • Privacy Policy