-
 This training document is a Rego Consulting Quick Reference Guide to assist with staffing the Idea Team in Clarity’s Modern User Experience.
 -
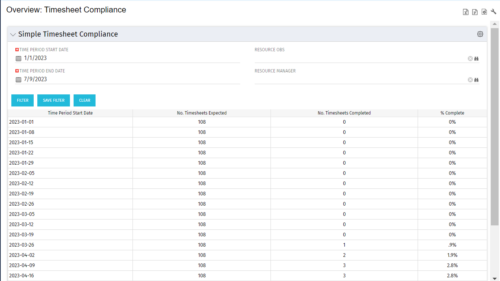 This portlet provides a view into the number of timesheets that were expected to be completed for a specified time period(s) as well as the number of timesheets that were completed and the percent complete. This can also be filtered by OBS so that a company can see timesheet compliance at the OBS level.
 -
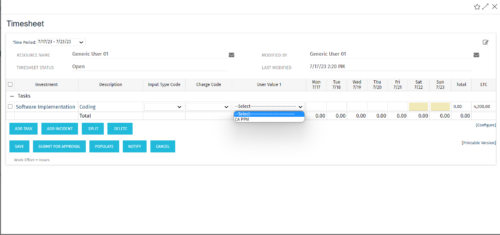 The tech-trick shows how to retrieve logged in User related values (ex: skill set) in timesheet.
 -
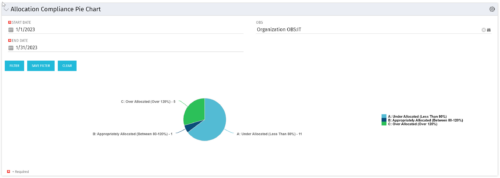 The Allocation Compliance Pie Chart portlet gives a view of active resources' allocation compliance within a date range and OBS displayed in a pie chart. It allows the user to the percentage of resources over, under, and adequately staffed on projects over a selected time period. This portlet leverages the daily allocation and daily availability slices as well as only active investments. The portlet provides filters for specific dates (required) and OBS.
 -
 ** No Download - Do not Add to Cart ** As Clarity's Modern UX continues to evolve with each release, so has the transition conversation among Clarity Product Owners and Administrators. It's no longer a question of "if" and "when;" the question is, how? In this webinar, we'll explore some best practices that enable a successful shift from Classic to Modern. Through a collaborative discussion of overarching strategies to a step-by-step checklist, this session is designed to help you quickly position your users to take advantage of Clarity's latest and greatest capabilities. Nothing to Download - See Link below. http://info.regoconsulting.com/when-to-move-to-modernux-aug-2020
 -
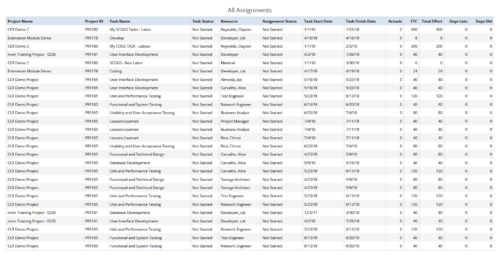 All Assignments report provides the Managers a single place to view all the assignments associated with a project(s). User can view only the investments that he has access to. This report also displays ETC, Actuals, Total Effort, Days Old (Elapsed days between Task Finish Date and Today's Date), Days Late (Elapsed days between Task Finish date and Task Baseline Finish date) associated with the task. You can further narrow your search by OBS Type & Path, Resource Name , Project Manager, Project Name, Project ID, Is project Active?, Assignment Start Date, Assignment Finish Date, Assignment Status and Task Status.
 -
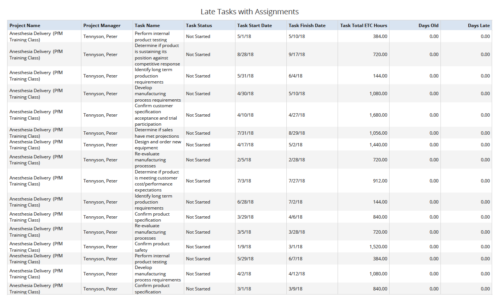 Late Tasks with Assignments report displays the list of all Tasks (with their Total ETC Hours) that are not closed but are past their finish date or past their baseline finish date. The report provides Project Manager the ability to view and track late tasks across multiple projects without going into each project individually. This report displays Project Name, Project Manager, Task Name, Task Status, Task Start Date, Task Finish Date, Days Old (Elapsed days between Task Finish Date and Today's Date), Days Late (Elapsed days between Task Finish date and Task Baseline Finish date). User can further narrow their search by Task Name, Task Status, Project ID, Project Name, Project Manager, Is Milestone?, Is late?, Task Start Date, Task Finish Date and Is Template?. User can use exact dates or relative dates for Task Start Date and Task Finish Date filter parameters.
 -
 Course description: “Is there a way to simplify time tracking? Time is a function 90% of companies use. What are ways to have time be less of a burden to users? How can you minimize the negative perception? This session will discuss options within CA PPM or outside CA PPM to make time tracking less of a burden for all.” Download file is the presentation slide deck.
 -
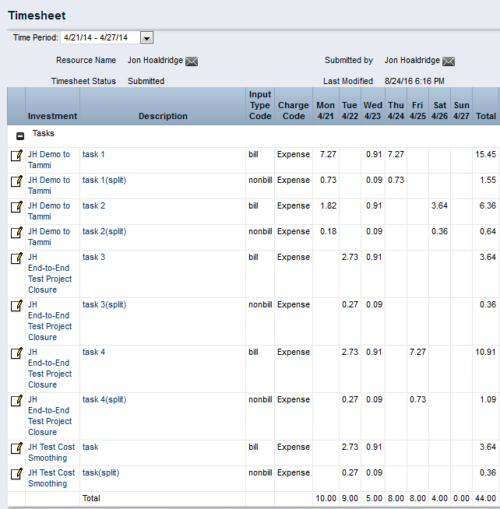
 This process workflow with gel script forces billable hours on timesheet down to 40 hours, and sets overtime hours to non-billable. Timesheets with 40 or fewer hours are not touched. Process kicks off upon submission of timesheet. Steps are:
- Determine if timesheet has > 40 hours. If so, proceed.
- Create a SPLIT row for each timesheet row, with Input Type Code = Non-Bill.
- Divide 40 by total timesheet ours. Store this value.
- Multiply each timesheet cell by the stored value, and enter the result into that cell.
- Take the difference (original cell value – new cell value), and enter in same cell on Split row.
- The end result will be 40 hours total on Billable rows, and overtime hours on Non-Billable rows.
-
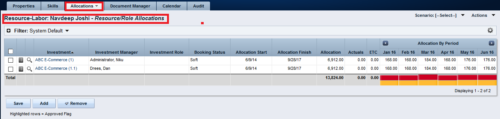
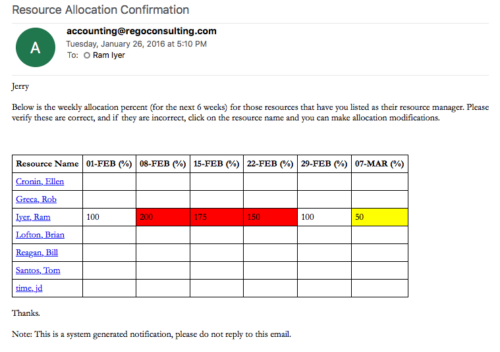 Process sends an email to RM, for resources assigned, that indicates the allocation percentage for each resource for the next 6 weeks. Email has links to each resource so that allocation modifications can be made as required.
 -
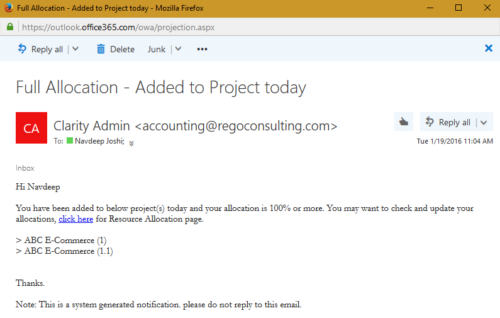 The process notifies resource who has been added to investment today and allocation is greater or equal to 100%. The process is on-demand and would require the user to have appropriate rights to run the process. Process should be scheduled as daily once job.
 -
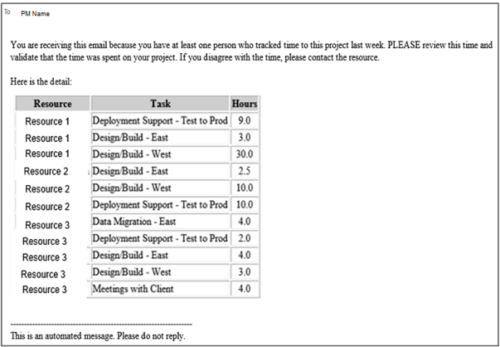 This process pulls in the total hours tracked, by resource, by task, for a given project for the weekly time period that ended. The information is sent to the Project Manager listed on the project. This process can be scheduled via the Execute a Process job.


Copyright 2023 • Rego Consulting Corporation • Privacy Policy