-
 Actuals & ETC by Resource Assignment report provides project managers a single place to view Actuals and ETC associated with resources across multiple Tasks and Projects. It displays the following: Actual and ETC Hours by Start Date: Stacked Column chart that displays the total Actual hours and ETC hours per month of fiscal period. Grey color indicates Actuals and Purple indicates ETC hours during that month. Grid: Displays Investment name, Task, Assigned resource ETC and Actual hours per month of fiscal period. It also displays aggregated column and row totals for Actuals and ETC hours. You can further narrow your search by OBS Type, OBS Path & Start Date range.
 -
 The All Assignments portlet displays resource assignments across multiple projects. Currently, assignment information displayed for the project, in OWB, or MSP is limited to a single project. This portlet will provide a single view of the assigned data for all assignments across multiple projects. The portlet displays project actuals and estimates from the project (datamart tables). The Days Late field is calculated by the baseline date, while the Days Old field is calculated by today's date. Note: Only the projects that the user has viewer rights to will show up in the list. Filters provide the PM, RM, and individual resource the ability to monitor work progress across multiple projects. For example: ~ PMs can filter for all assignments that were to be completed by a given date but still have "Started" or "Not Started" status. ~ If multiple projects are utilizing the same resource, the PM or RM can filter for assignments utilizing that specific resource to prevent over-utilization. ~ A resource may filter for all assignments assigned to them, providing a picture of their total body of work.
 -
The All Assignments portlet displays resource assignments across multiple projects. Currently, assignment information displayed for the project, in OWB, or MSP is limited to a single project. This portlet will provide a single view of the assigned data for all assignments across multiple projects. The portlet displays project actuals and estimates from the project (datamart tables). The Days Late field is calculated by the baseline date, while the Days Old field is calculated by today's date. Note: Only the projects that the user has viewer rights to will show up in the list. Filters provide the PM, RM, and individual resource the ability to monitor work progress across multiple projects. For example: ~ PMs can filter for all assignments that were to be completed by a given date but still have "Started" or "Not Started" status. ~ If multiple projects are utilizing the same resource, the PM or RM can filter for assignments utilizing that specific resource to prevent over-utilization. ~ A resource may filter for all assignments assigned to them, providing a picture of their total body of work.
-
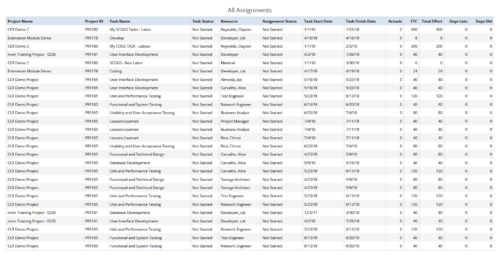 All Assignments report provides the Managers a single place to view all the assignments associated with a project(s). User can view only the investments that he has access to. This report also displays ETC, Actuals, Total Effort, Days Old (Elapsed days between Task Finish Date and Today's Date), Days Late (Elapsed days between Task Finish date and Task Baseline Finish date) associated with the task. You can further narrow your search by OBS Type & Path, Resource Name , Project Manager, Project Name, Project ID, Is project Active?, Assignment Start Date, Assignment Finish Date, Assignment Status and Task Status.
 -
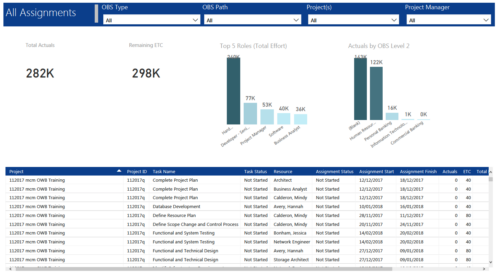 All Assignments report provides project managers a single place to view KPIs related to Task Assignments. All the KPIs are depicted in various visualizations. Total Actuals: Scorecard that displays the sum of actuals associated with assignments for the selected criteria. Remaining ETC: Scorecard that displays the sum of current ETC associated with assignments for the selected criteria. Top 5 Roles (Total Effort): Column chart that displays Effort (Actuals + ETC) by Roles. X axis displays various Roles. Data labels indicate sum of effort associated with that Role. Actuals by OBS level 2: Column chart that displays Actuals by OBS level 2. X axis displays various OBS level 2. Data labels indicate sum of actuals associated with that OBS. Grid: Displays Assignment details such as Project ID, Project Name, Task Name, Task Status, Assigned Resource, Assignment Status, Assignment Start, Assignment Finish, Actuals, ETC, Total Effort, Days Late and Days Old. You can further narrow your search by OBS Type, OBS Path, Project(s) and Project Manager.
 -
 The Assignments by Task Over Time portlet displays all assignments by task for all resources using the timeslices. This portlet is useful for determining which tasks a user is assigned to or how many hours the user is assigned to a task. The user may filter on certain criteria that include: project name/ID, date range, resource name/ID, and resource OBS unit.
 -
The Assignments by Task Over Time portlet displays all assignments by task for all resources using the timeslices. This portlet is useful for determining which tasks a user is assigned to or how many hours the user is assigned to a task. The user may filter on certain criteria that include: project name/ID, date range, resource name/ID, and resource OBS unit.
-
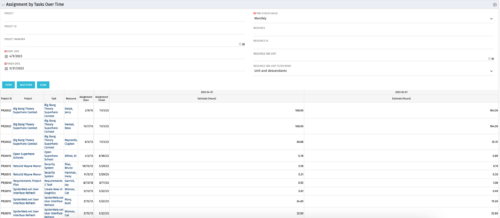
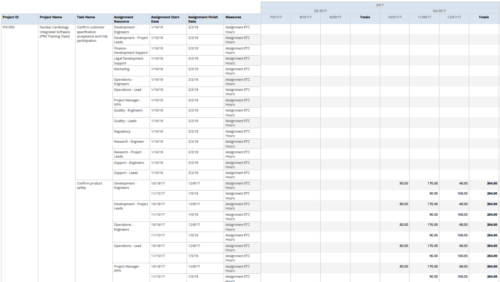 Assignments by Task Over Time report display all assignments by task for all resources. Information can be drilled down to yearly, quarterly or monthly level. This report helps in determining the tasks a user is assigned to or how many hours a user is assigned to a task. You can further narrow your search by OBS Type & Path, Project ID, Project Name, Task Name, Assignment Resource, Is project Active?, Is Template? And Month End date.
 -

A presentation slide deck from Rego University 2022. This document reviews the best practices for resource management in Clarity. - Implementation
- Availability
- Allocation
- Assignment
- Reporting
- Notification
- Data Maintenance
-
 The Capacity Graph - Investment portlet displays Availability, Allocations, Assignments and Actuals for active resources in a single project. This portlet pulls from timeslices and allows the user to filter on weekly, monthly, or quarterly data. This portlet provides a Project Manager with a simple way to analyse: Allocations vs. Actuals and Allocations vs. ETC. Depending on metric goals, the graph allows the user to determine where areas of improvement may exist.


Copyright 2023 • Rego Consulting Corporation • Privacy Policy