
Rego’s Clarity Adoption Metrics package consists of two sets of metrics: Project metrics, and Resource metrics. Project metrics measure how effectively project managers are using Clarity to manage their projects. Resource metrics measure how effectively resource managers are using Clarity to manage resources.
Metrics are scored on a scale of 0 to 5, with higher scores indicating greater adoption and use. All metrics can be viewed numerically or graphically, and can be broken out by OBS. In addition, metric data can display as a 12-month rolling history to help identify trends. Project metrics can also display by lowest / highest adoption rates for a specific resource metric or all resource metrics.
There is a variety of way to view the Adoption Metric data, therefore, Rego has made this simple by creating an Adoption Metrics object that contains multiple tabs. Each tab displays one or more of the Project or Resource Adoption Metrics. Based on the nature of the Metrics some tabs will allow the ability to use a pull down menu to select a specific Adoption Metric. There is also a Metrics trending view that pulls monthly snapshots of the metrics.
Project metrics consist of the following:
|
-

-
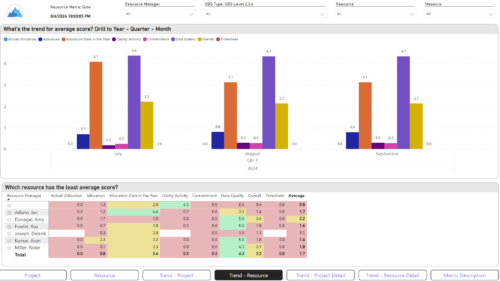
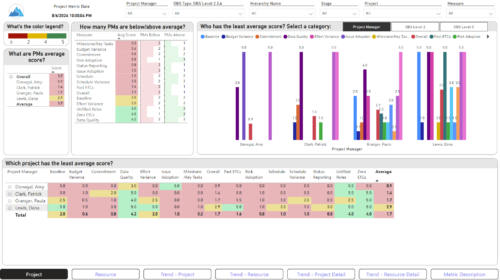 The Adoption Dashboard is designed to enhance data integrity and project tracking within Clarity by providing insights into how well users are populating and managing their project and resource data. Features: · Project Data Quality Evaluate the accuracy of project status reporting, risk, issue tracking, and schedule adherence. · Resource Data Quality Assess how well resource managers are managing timesheets, allocations, and actual utilization. · Adoption Scoring View Rate the consistency of data entry across projects and resources on a scale of 0-5, helping identify areas needing improvement. · Variance Analysis View Track discrepancies in project schedules, effort, budgets, and resource commitments. · Compliance Monitoring Ensure that all necessary project and resource data is up-to-date, aiding in more informed decision-making and better project outcomes.
 -
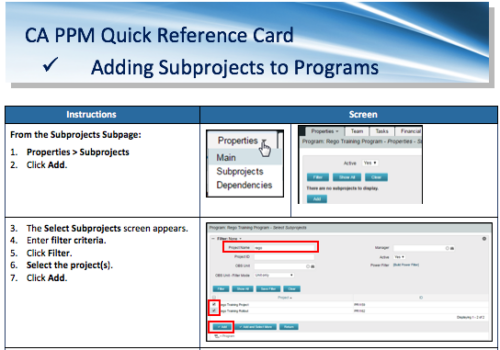 A Quick Reference Card to assist in the adding of Subprojects to Programs. Shows how add and remove from the Subprojects Subpage or from the Hierarchy Tab.
 -
 Actuals & ETC by Resource Assignment report provides project managers a single place to view Actuals and ETC associated with resources across multiple Tasks and Projects. It displays the following: Actual and ETC Hours by Start Date: Stacked Column chart that displays the total Actual hours and ETC hours per month of fiscal period. Grey color indicates Actuals and Purple indicates ETC hours during that month. Grid: Displays Investment name, Task, Assigned resource ETC and Actual hours per month of fiscal period. It also displays aggregated column and row totals for Actuals and ETC hours. You can further narrow your search by OBS Type, OBS Path & Start Date range.
 -
 Imagine responding to Clarity PPM workflow tasks (like timesheet approvals, budget reviews, and stage gate decisions) directly from your email. No login required, yet all conversations, decisions, and even context from attachments and images are automatically - and securely - captured in Clarity. Sound like a dream? Join this class to learn how to save time and increase adoption with this easy innovation.
 -
 You are no longer regulated to the desktop browser to respond to action items. Learn how Rego solved this problem using just your email. We’ll talk about various use cases where you would get maximum benefit from a simple response on an action item directly from your email. It doesn’t matter if you are using email on your desktop, laptop, phone or tablet. The Action Item Responder as you covered.
 -
 This training document is a Rego Consulting Quick Reference Guide to assist with accessing the various project views in Clarity’s Modern User Experience. Reviews the Tile, Grid and Board views for projects.
 -
 A review of how AbbVie is driving greater visibility into projects at the Executive level and is eliminating/reducing duplicative work across the Business Technology Solutions organization by simplifying the overall PPM landscape. This has been accomplished through implementation of consistent processes supported by Clarity as well as through system integrations with legacy systems like SAP, Fieldglass, and other Project Scheduling tools.
 -
 Bringing back a classic topic with a modern update! Join this session to discuss tips and tricks for an optimized project manager experience in Clarity. This session is designed so attendees can share, collaborate, and benefit from their diverse experiences.
 -
 Bringing back a classic topic with a modern update! Join this session to discuss tips and tricks for an optimized PMO experience in Clarity. This session is designed so attendees can share, collaborate, and benefit from their diverse experiences.
 -
 A presentation slide deck from Rego University 2022. Document reviews the 7 trends that Rego is seeing in the PPM space.
- Trend 1: Going Beyond Strategic Alignment
- Trend 2: Pivoting Quickly
- Trend 3: Value Scrutiny for PPM
- Trend 4: Hybrid Financial Management
- Trend 5: AI has the Buzz, Predictive Analytics has the Momentum
- Trend 6: Balanced Ecosystem of Tools
- Trend 7: Collaboration
