-
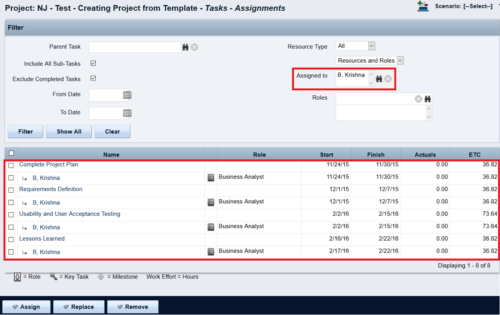
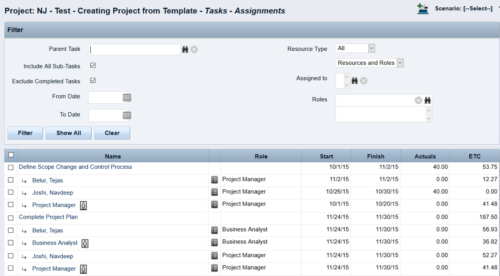 This Tech Trick walks you through the steps in CA PPM to make Bulk Role replacements on tasks. Useful when you want to make the changes to the project template which has a large WBS structure, and a lot of role assignments to tasks.
 -
 This portlet shows the variance between the budgeted cost and the planned cost for projects. This allows for the variance to be displayed between what was planned and what was approved. This provides the PMs with the ability to better plan the costs.
 -
This portlet shows the variance between the budgeted cost and the planned cost for projects. This allows for the variance to be displayed between what was planned and what was approved. This provides the PMs with the ability to better plan the costs.
-
This portlet shows the variance between the budgeted cost and the planned cost for projects. This allows for the variance to be displayed between what was planned and what was approved. This provides the PMs with the ability to better plan the costs.
-
 Bar Chart displays average percent variance for all active projects by OBS unit. Percent variance = Planned Cost - Budgeted Cost / Budgeted Cost * 100. Projects with no Budgeted Cost are ignored for the calculation. Then all project variance percentages are algebraically added (some may be negative), and divided by total projects with a variance. This yields the Average Percent Variance. This calculation is performed for active projects in each OBS unit. OBS units include all units at all levels where projects are attached. Portlet filterable by OBS, Financial Status, and Financially Approved. Vertical axis = OBS Unit Name. Horizontal axis = Variance Percent. Data value = Average Percent Variance. Mouseover value = OBS Name + Average Variance Percent.
 -
Bar Chart displays average percent variance for all active projects by OBS unit. Percent variance = Planned Cost - Budgeted Cost / Budgeted Cost * 100. Projects with no Budgeted Cost are ignored for the calculation. Then all project variance percentages are algebraically added (some may be negative), and divided by total projects with a variance. This yields the Average Percent Variance. This calculation is performed for active projects in each OBS unit. OBS units include all units at all levels where projects are attached. Portlet filterable by OBS, Financial Status, and Financially Approved. Vertical axis = OBS Unit Name. Horizontal axis = Variance Percent. Data value = Average Percent Variance. Mouseover value = OBS Name + Average Variance Percent.
-
 Value Stream Management (VSM) isn’t just another buzzword; it’s the visibility layer your digital transformation is starving for. In this session, learn how to map, measure, and maximize value across the entire delivery lifecycle.
 -

A presentation slide deck from Rego University 2022. This document reviews the best practices for project management in Clarity. - Typical PM Activities
- Use Clarity: Get Off of Excel
- Make Information Easier to Access
- Make Flags Easy to Identify
- Simplify & Automate Reporting
- Open Discussion #3
- Work with a Regular Cadence
- Sample Schedule
-
 This session will align you with best practices for using Clarity's project management functionality. Come and learn about the OOTB capabilities for excellent project management, including: scheduling, assignments, staffing, views, financial plans, and other general project management capabilities. Additionally, tips and tricks will be shared, providing you with a toolkit of ideas for your organization!
 -
 This session will align you with some of the best and most common practices for using Clarity's Project Management capabilities. Come and learn about the capabilities that come out of the box for excellent project management. Things like scheduling, assignments, staffing, views, financial plans and other general project management capabilities will be covered. Additionally, tips and tricks will be discussed leaving you with a toolkit of ideas.
 -
 This session will aligning you with some of the best and most common practices for using Clarity's Project Management capabilities. Come and learn about the capabilities that come out of the box for excellent project management. Things like objects, views, financial plans and general project management capabilities will be covered. Additionally, tips and tricks will be discussed leaving you with a toolkit of ideas.


Copyright 2023 • Rego Consulting Corporation • Privacy Policy