-
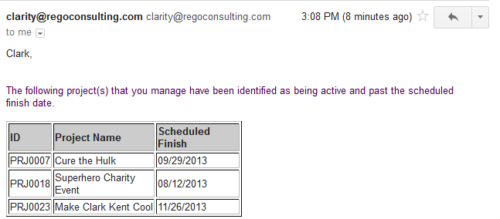 Based on the pre-determined schedule frequency, this job will send an email to Project Managers that have a project meeting the criteria of: project(s) are active and scheduled finish date is less than the current date. This serves as a reminder to Project Managers to keep their schedules true. The contents of the email include a message indicating the project manager has at least one project meeting this criteria and a table indicating the Project ID, Project Name and Scheduled Finish Date.
 -
 The Move Role to Team/Assignment process takes the role from the resource object and pushes that information into the team and assignment objects when the role is NULL on the team and assignment objects. This happens normally, assuming a resource has their primary role populated. This process is needed if a resource or set of resources were added to projects without having their primary role filled in.
 -
The Move Role to Team/Assignment process takes the role from the resource object and pushes that information into the team and assignment objects when the role is NULL on the team and assignment objects. This happens normally, assuming a resource has their primary role populated. This process is needed if a resource or set of resources were added to projects without having their primary role filled in.
-
 The Grant Project Edit Rights workflow process allows a project manager to grant project edit rights to another user without contacting an administrator. The workflow uses the Out-of-the-box field for Business Owner. The script starts when the field is updated. It will assign project edit rights to whichever user is added to the Business Owner field. This process can be modified to grant project edit rights to any user within a project field.
 -
 The Convert Incident to Task workflow process allows users to quickly create tasks from incidents without the need to input the information twice. It utilizes a newly added checkbox and project fields on the incident object. The user will need to select the project that he or she wants the task added to using the “Project” field on the incident object. Next, the “Convert to Task” checkbox will kick off the process. Once ticked, the process will perform the necessary actions to create a task on the specified project.
 -
The Convert Incident to Task workflow process allows users to quickly create tasks from incidents without the need to input the information twice. It utilizes a newly added checkbox and project fields on the incident object. The user will need to select the project that he or she wants the task added to using the “Project” field on the incident object. Next, the “Convert to Task” checkbox will kick off the process. Once ticked, the process will perform the necessary actions to create a task on the specified project.
-
 The Re-Baseline via Change Request process is a simple method for a member of the project (who has the ability to create change requests) to request a re-baseline of the project without the project manager having to perform it. First, the user must create the change request. The user must then start the process within the change request by using the Processes tab. Once started, the process will route an action item to the Project Manager. If rejected, the process will end and the user must start it again (if needed). If approved, the process will then baseline the project and close out the change request.
 -
 Course Description: Does your organization own Workfront in a marketing or other group doing digital asset management? In this session, we will dive into what Workfront is and how it complements your current Clarity PPM solution.
 -
 Course Description: Do you want to talk to other customers that are using or plan to use project management? In this moderated round table, customers can share experiences and provide insights on process, configurations, challenges, and successes. We will divide into small groups and discuss customer selected topics—100% sharing
 -
 Course Description: Do you want to improve the success of your projects? This class will discuss some lessons learned on making projects more successful. We will discuss things like: • Developing robust test plans, creating effective use and test cases, and implementing test scripts that make sense.
- Why failures occur and what you can do to minimize the impact and plan for success—including a case study on lessons learned.
- Developing, testing, fine-tuning, and executing deployment plans for success.
-
 Course Description: How mature is your PMO? Where do you go from here? This class is a working session, which includes an exercise to assess how far you’ve come and help direct your course.


Copyright 2023 • Rego Consulting Corporation • Privacy Policy