-
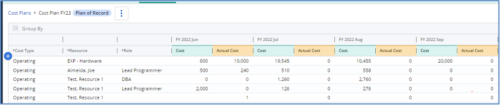
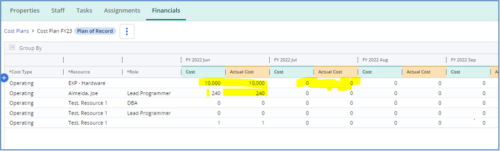 The Populate Prior Periods Forecast From Actuals in Cost Plans process updates Cost Plans for Active Projects, it updates the Forecast for previous months = Posted Actuals, to remove variances from past periods. This is an On Demand process in Clarity named Populate Prior Periods Forecast From Actuals in Cost Plans and can be manually executed from the Organizer or scheduled through the “Execute a Process” job. If there are number of processes in the Organizer – Available Processes, this process can be filtered and then checked to Start. When the process is started it will be seen in the Initiated on the Processes tab. The process status can be monitored from Running to the Completed stage. The process is very flexible and supports Cost Plans with any given grouping and it also works without any dependency on timeslices or other jobs. The process fetches Cost plan of records for all active projects in the system that have Actuals transactions in WIP table. It then process those cost plans to update all of the prior monthly forecast periods with the corresponding monthly Actuals.
 -
 Lean Portfolio Management (LPM) is one of the seven SAFe components of the Lean Enterprise. LPM helps organizations solve numerous challenges by decreasing the delivery of time to value, enabling the organization to pivot quickly in ever-shifting markets, and more.
 -
 This training document is a Rego Consulting Quick Reference Guide to assist with Status Reporting in Clarity’s Modern User Experience. The document reviews Status Reporting via the Status Tab and the Status Reporting Tab – Grid View.
 -
 This training document is a Rego Consulting Quick Reference Guide to assist with use of the Task List Tab to manage project tasks in Clarity’s Modern User Experience. Document reviews the Task List Tab, and the Task Tab Sub Tabs.
 -
 A Quick Reference Guide to assist in the population of the Project Property Details. Reviews accessing and updating the project property details. Also shows alternative in-line edits.
 -
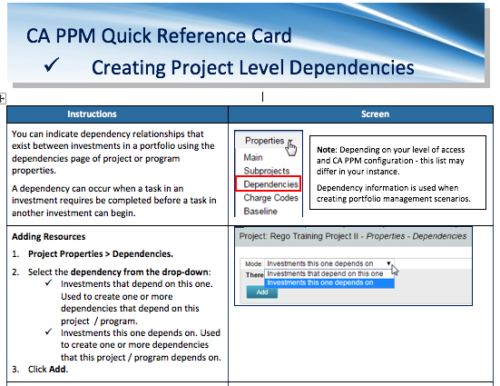 A Quick Reference Card to assist in the creation of project level dependencies. You can create dependency relationships that exist between investments in a portfolio using the dependencies page of project or program properties. A dependency can occur when a task in an investment requires to be completed before a task in another investment can begin.
 -

The Transaction Adapter – is a text based CSV file which automates the importing of monthly non labor financial data into Clarity directly from your financial system. This integration eliminates the need to create non-labor transactions manually in Clarity and will provide more accurate project, program, and portfolio financial reporting. -
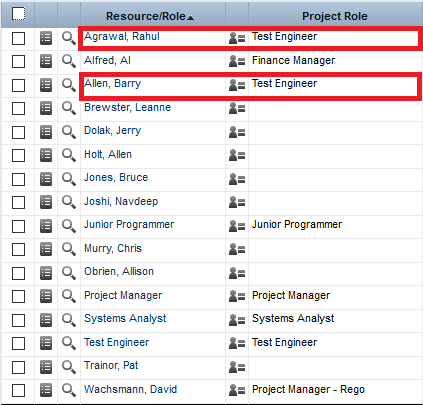
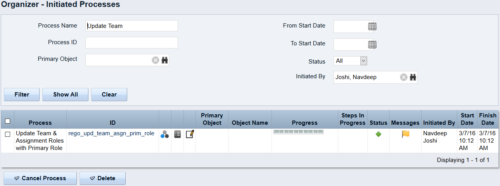 This process updates the team, assignment and timesheet roles with the primary role where they do not match. This way, the PM can push all roles to team and assignment for that project before they do a cost plan.
 -
 Are you struggling with implementing Agile tools in your organization in addition to Clarity? This class will review best practices for implementing agile tools in conjunction with Clarity - living in a Bi-Modal world. We will discuss how Clarity can be used to govern both types of work and teams and how Agile tools should interface into Clarity.
 -
 No matter how hard we try, many organizations cannot pry Excel out of the hands of project and resource managers. In this class we will explore possibilities that give up the battle and embrace Excel as a great data entry tool. We will show some neat case studies on quick Excel integrations deployed at customers.
 -

 The Capacity Graph portlet displays Availability, Allocations, Actuals and Assignments for one or more active resource(s) in a single view. This portlet pulls data from timeslices, and allows the user to filter on a weekly, monthly or quarterly data. The Estimated Time to Complete (ETC) and Allocation data will only show for projects that are active. This portlet provides Resource Managers, PMOs and Executives with a simple way to analyse: Allocations vs. Availability, Allocations vs. Actuals, Allocations vs. ETC and ETC vs. Availability. The graph allows the user to determine where areas of improvement may exist and quickly identify potential areas of constraint. Note: the information displayed is dependent on what the user has security rights to view.
 -
The Capacity Graph portlet displays Availability, Allocations, Actuals and Assignments for one or more active resource(s) in a single view. This portlet pulls data from timeslices, and allows the user to filter on a weekly, monthly or quarterly data. The Estimated Time to Complete (ETC) and Allocation data will only show for projects that are active. This portlet provides Resource Managers, PMOs and Executives with a simple way to analyse: Allocations vs. Availability, Allocations vs. Actuals, Allocations vs. ETC and ETC vs. Availability. The graph allows the user to determine where areas of improvement may exist and quickly identify potential areas of constraint. Note: the information displayed is dependent on what the user has security rights to view.
-
 The Rego PowerBI Reporting Suite features close to 100 free PowerBI reports, designed to enhance project management and reporting capabilities.
 -
 Bringing back a classic topic with a modern update! Join this session to discuss tips and tricks for an optimized project manager experience in Clarity. This session is designed so attendees can share, collaborate, and benefit from their diverse experiences.
 -
 Bringing back a classic topic with a modern update! Join this session to discuss tips and tricks for an optimized PMO experience in Clarity. This session is designed so attendees can share, collaborate, and benefit from their diverse experiences.
 -
This training document is a Rego Consulting Quick Reference Guide to assist with the staffing of a Team on an investment in Clarity’s Modern User Experience. This doc references version 16.2.1 views. Doc covers Common Terms, setting up a Default Allocation, Allocation vs ETC, Staff Tab, and Staffing the Team – Time Scale.
-
 This training document is a Rego Consulting Quick Reference Guide to assist with the management of Project Tasks via the PPM Gantt view in Clarity’s Modern User Experience. This doc references version 16.1.2 views. Doc covers PPM Gantt, View Legend, Menu Icons, Create New Task, Indent Tasks, Move Tasks and Set Dependencies.
 -
 This training document is a Rego Consulting Quick Reference Guide to assist with Idea approval and conversion to projects in Clarity’s Modern User Experience. This doc references version 16.1.2 views. Doc reviews setting Ideas as Approved and converting Ideas to projects.
 -
 This training document is a Rego Consulting Quick Reference Guide to assist with the utilization of Tasks and To Do’s in Clarity’s Modern User Experience. This doc references version 16.1.2 views. Document references the Tasks and To Do’s menu items and their associated widgets.
 -
 Are you struggling with implementing Agile tools in your organization in addition to Clarity? This class will review best practices for implementing agile tools in conjunction with Clarity - living in a Bi-Modal world. We will discuss how Clarity can be used to govern both types of work and teams and how Agile tools should interface into Clarity.
 -
 The hit TV series Ted Lasso is well known for its humor and entertainment value, but hidden under the light-hearted banter are some important messages that leaders can take to heart. Join expert Agile guide, Tad Beaty, for a review of the first two seasons of the show. We’ll explore the messages that all leaders should take back to the office to improve engagement and make a better workplace.
 -
 Hear what the journey from Project to Product looks like from the trenches. IHG will share tales of what it took to make this transition, some challenges they faced, and what outcomes they have been able to achieve.
 -
 Agile metrics can be very different from traditional waterfall metrics. This session will walk through some of the key Agile metrics describing how and why they are used. Effective methods in reporting and sharing will also be covered.
 -
 This video describes the process of creating new tasks and working with the Work Breakdown Structure (WBS) within Open WorkBench. The video is available in both .m4v and .wmv formats.
 -
 This training document is a Rego Consulting Quick Reference Guide to assist with the creation of Status Reports in Clarity’s Modern User Experience. This doc references version 16.0.3 views. Document covers the creation of Status Reports via the Status Module as well as the Status Report Module. Detail is provided on the widgets that can be used within the Status Report canvas as well as instructions on how to configure the canvas. Detail is also provided on how to Preview and Publish status reports.
 -
 This training document is a Rego Consulting Quick Reference Guide to assist with placeholder role replacement in Clarity’s Modern User Experience. The document reviews accessing and fulfilling requests.
 -
 This training document is a Rego Consulting Quick Reference Guide to assist with the use of Sub-Objects and Channels in Clarity’s Modern UX.
 -
 This training document is a Rego Consulting Quick Reference Guide to assist with the population of project properties in Clarity’s Modern User Experience. Documents starts with accessing the project via the Tile module. Then shows how to update properties in the Details page and in the Project List.
 -


The Percent Time by Type and Timescale - Grid portlet shows a breakout of time by timescale for resources the logged in user has view rights for using the timeslices. This portlet gives the Clarity user the ability to show the amount of hours spent on a project by week, month, quarter and year. Using this portlet, the Clarity user can get an overview of all hours in a time period or use the filter to search for a specific dataset (as required). The portlet provides a filter for OBS and date ranges. -
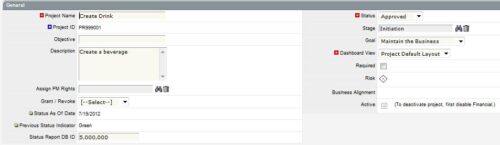
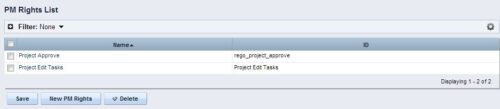 The Allow PM to Give Certain Rights modification allows the project manager to delegate rights (chosen by the administrator on the PM Rights object) on his or her projects. This modification eliminates the need for project managers to request additional rights through the PMO/management and simplifies the entire process for everyone involved. The system administrator is able to customize the PM Rights object to pick which rights should be granted to users by the process. The process begins when a change is made on the newly created “Grant / Revoke” field on the project object. The process will then grant or revoke (depending on what option is selected) any rights listed in the PM Rights object to the user in the “Assign PM Rights” field on the project object.
 -
 Course description: “How are other companies storing or managing documents? This session will discuss options for using native CA PPM, linking to SharePoint, connecting directly to SharePoint, using Google docs, as well as other options. This session will also discuss options for document approval workflows within CA PPM for both collaborative documents and attachment fields.” Download file is the slide deck used during the presentation.
 -
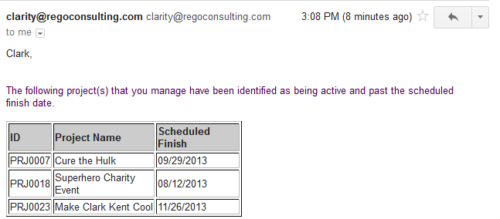 Based on the pre-determined schedule frequency, this job will send an email to Project Managers that have a project meeting the criteria of: project(s) are active and scheduled finish date is less than the current date. This serves as a reminder to Project Managers to keep their schedules true. The contents of the email include a message indicating the project manager has at least one project meeting this criteria and a table indicating the Project ID, Project Name and Scheduled Finish Date.
 -
 Do you want to understand the OOTB configuration and functionality of project management? In this class, we will review the OOTB objects, views, and functions of projects, financial plans, tasks/assignments, IRC, and other related areas. We will cover both classic and new UX highlighting differences.
 -
 Have you looked in the regoXchange or reviewed Rego’s innovation offerings? This class will show you the power of Rego’s pre-built content library, integrations, and other assets. See example after example of portlets, processes, and materials you can use to add value to your instance of Clarity. Learn how you can introduce email-based approvals with Rego's action item responder. Get a peek at Rego's new MSP integration that avoids the issues faced with the OOTB integration. Finally, understand Rego's pre-built connectors and how they can benefit your instance. Including blueprint migrator. Include free tools like GEL builder, query, XOGbridge.
 -
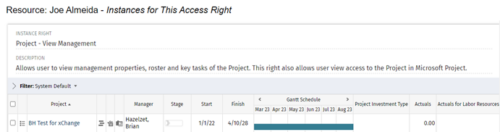
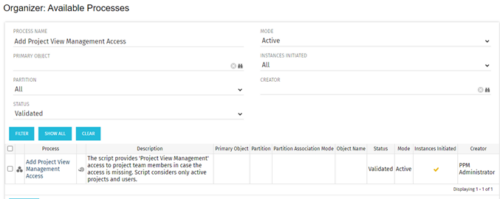 This process grants Project Management instance rights to all of the project team members within the program hierarchy. Allows users to view management properties, roster and key tasks of the project. This also allows user view access to the project in Microsoft Project.
 -
 This training document is a Rego Consulting Quick Reference Guide to assist with the use of the Staffing View in Clarity’s Modern User Experience. This doc references version 16.1 views. Document provides information on how to swap between views to see investments by resource or resources by investment. Instructions on filtering are provided, as well as detail on how to update the unit of measure between FTE (Full Time Equivalent) and Hours. Tips are provided on how to expand the list of investments within each view and how to view the properties for the allocations. A Legend is also documented to provide information on each of the icons that are displayed on this page.


Copyright 2023 • Rego Consulting Corporation • Privacy Policy