-
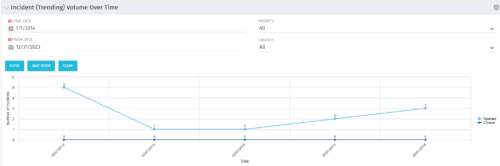 This view depicts trends of created and resolved Incidents over time, grouped by month. The count of incidents opened is determined by the Created Date of the Incident, and the count of Incidents closed is determined by the Resolution Date of the Incident. The view is filterable by Priority and Urgency as well as a date range. NOTE: The values returned are the total sum for a given month, not a cumulative total over time.
 -
This view depicts trends of created and resolved Incidents over time, grouped by month. The count of incidents opened is determined by the Created Date of the Incident, and the count of Incidents closed is determined by the Resolution Date of the Incident. The view is filterable by Priority and Urgency as well as a date range. NOTE: The values returned are the total sum for a given month, not a cumulative total over time.
-
 This grid portlet to show projects with finish or start date of project more than 20 years in future or past. The portlet automatically displays results when accessed. The user can apply filters to fetch the desired information.
 -
This grid portlet to show projects with finish or start date of project more than 20 years in future or past. The portlet automatically displays results when accessed. The user can apply filters to fetch the desired information.
-
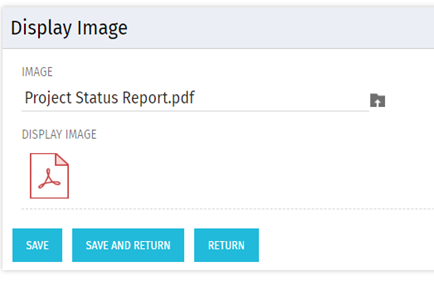 There are many times user’s wants to see the preview of file uploaded on attachment attribute. This Technical Trick will illustrate the steps for an Administrator to preview an attachment. This solution will help to preview PDF, Text file and Image(.png) file. For Microsoft word, PowerPoint and Microsoft Excel, it displays an icon.
 -
 Hear what the journey from Project to Product looks like from the trenches. IHG will share tales of what it took to make this transition, some challenges they faced, and what outcomes they have been able to achieve.
 -
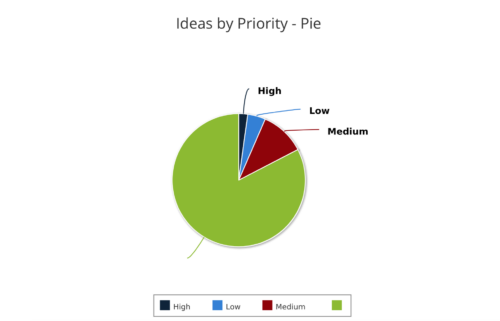 Ideas by Priority report is a pie chart that displays ideas count by priority. Mouse over on the pie chart displays idea count for that priority. You can further narrow your search by OBS Type, OBS Path, Idea Status, Idea Start Date and Is Idea Active?
 -
 Pie Chart displays total Ideas by Priority, filterable by Active / Inactive and by OBS structure. Data Label and Mouse-over label display counts by Priority. Legend shows Priority Name. Chart also shows Ideas with No Priority.
 -
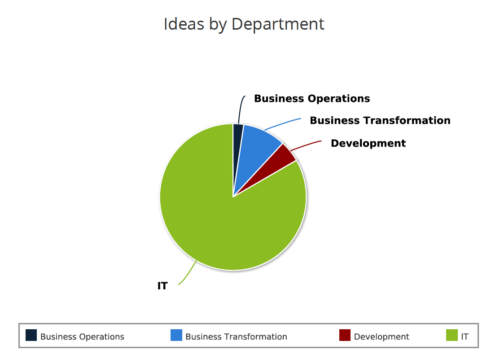 Ideas by Department report is a pie chart that displays count of ideas by department. Mouse over on the pie chart displays idea count for that department. You can further narrow your search by OBS Type & Path , Idea Status, Idea Start Date and Is Idea Active?.
 -
 Pie Chart displays count of all Ideas by Department. Filterable by Active and Inactive, by OBS, and by Department Manager. Data label and mouse-over show department counts. Legend displays department names.
 -
Pie Chart displays count of all Ideas by Department. Filterable by Active and Inactive, by OBS, and by Department Manager. Data label and mouse-over show department counts. Legend displays department names.
-
 Part of the Business Transformation Content collection, this bar chart portlet displays count of ideas per business unit. This provides a holistic view of the idea pipe-line in an organization providing them a high-level of ideas converted, approved, unapproved per business unit.


Copyright 2023 • Rego Consulting Corporation • Privacy Policy