-
 The Status Report Publish workflow process pushes values from the status report sub-object to the parent project object. The process is started when the user ticks the “Publish” Boolean field on the status report (custom field added). This workflow will update the project object with the overall status indicator, the status comment, the previous overall status, and the as of date. This eliminates the project manager having to update the fields in both the status report and the project overall.
 -
 The Grant Project Edit Rights workflow process allows a project manager to grant project edit rights to another user without contacting an administrator. The workflow uses the Out-of-the-box field for Business Owner. The script starts when the field is updated. It will assign project edit rights to whichever user is added to the Business Owner field. This process can be modified to grant project edit rights to any user within a project field.
 -
 The Re-Baseline via Change Request process is a simple method for a member of the project (who has the ability to create change requests) to request a re-baseline of the project without the project manager having to perform it. First, the user must create the change request. The user must then start the process within the change request by using the Processes tab. Once started, the process will route an action item to the Project Manager. If rejected, the process will end and the user must start it again (if needed). If approved, the process will then baseline the project and close out the change request.
 -
 Course Description: How do companies track stage gates within Clarity PPM? This session will review some best practices for tracking, monitoring, and approving stage gates within Clarity PPM. We will also discuss pros and cons of various options to help you select the best method for your company.
 -
 Course Description: Does your company have Office 365, but you’re not sure what it can do for you? This session will cover what Office 365 is, including insights into how Office 365 can help your teams work faster and smarter.
 -
 Course Description: Are your project teams using SharePoint effectively and getting the most value out of it? Is document management a daily struggle? Learn how to use SharePoint with Clarity PPM to seamlessly improve collaboration and team productivity.
 -
 Learn about the various techniques and emerging methods companies are taking to capitalize Agile work. You'll learn how some companies are moving away from timesheets and using models based on story points and team rates to generate capitalization reporting.
 -

This portlet displays the monthly allocation per resource. The PM can view by the RM or the resource to get the data for monthly resource allocations. The table below describes the available filter fields in the portlet. Column Label Description Work Effort Manager Manager of the Investment the Work Effort is on Work Effort Active Active status of the Investment the Work Effort is on Resource Resource’s Name Internal Resource ID Resource’s ID Zero Allocation Show Allocations that equal zero Open for Time Entry Is the Resource Open for Time Entry Resource Active Resource’s Active status Role Resource’s Primary Role OBS Unit Resource’s OBS Start Allocation Start Time to filter by End Allocation Finish time to filter by -
 Bar Chart displays average percent variance for all active projects by OBS unit. Percent variance = Planned Cost - Budgeted Cost / Budgeted Cost * 100. Projects with no Budgeted Cost are ignored for the calculation. Then all project variance percentages are algebraically added (some may be negative), and divided by total projects with a variance. This yields the Average Percent Variance. This calculation is performed for active projects in each OBS unit. OBS units include all units at all levels where projects are attached. Portlet filterable by OBS, Financial Status, and Financially Approved. Vertical axis = OBS Unit Name. Horizontal axis = Variance Percent. Data value = Average Percent Variance. Mouseover value = OBS Name + Average Variance Percent.
 -
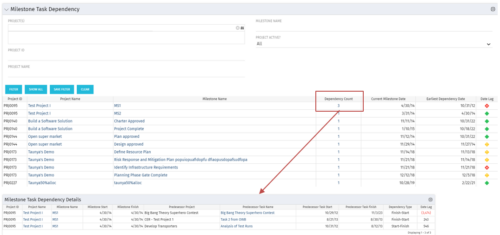 The Milestone Task Dependency portlet shows the milestone task dependency count and has a drilldown to the details. The portlet looks at the dependency impact on milestones, and is not limited to just dependencies that are on different projects. The lag days calculation is based off of the maximum dependency impact and the drilldown portlet (Milestone Task Dependency Details :::: rego_milestone_dependency_det)shows the details for each.
 -
 This portlet will allow administrators or other managers to see what resources have been granted instance rights to any investment. Filtering is available by resource, investment or right.
 -
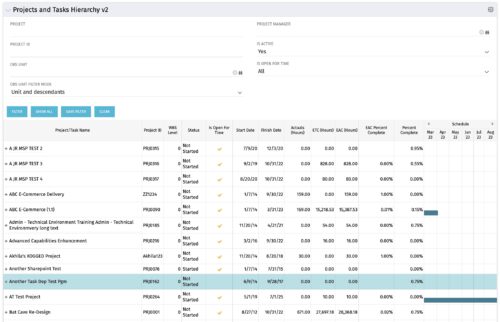 Grid Portlet displays project and task data--including name, dates, status, effort, %Complete, and schedule. Portlet initially displays project data. But there is a + sign toggle, which, when clicked, reveals task data, and the toggle becomes a – sign. User can choose to Automatically Expand all levels from Options Icon>Configure>List Column Section>Options. Portlet supports up to 10 levels of WBS. Portlet filterable by project name and ID, OBS structure, manager name, active/inactive, and open for time entry.


Copyright 2023 • Rego Consulting Corporation • Privacy Policy