-
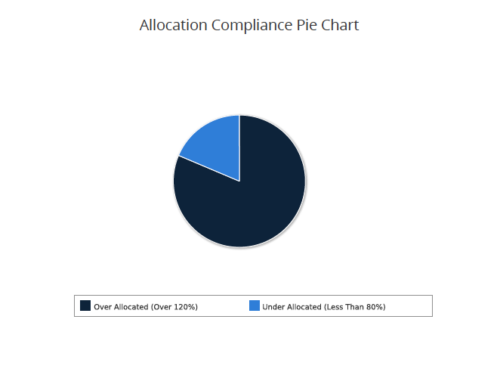 Allocation Compliance Pie Chart provides the resource manager a single place to view the Allocation compliance information in the form of a Pie chart. Allocation Compliance is calculated based on the value of 'Availability to Allocation Hours %'. Allocation Compliance is 'Under Allocated (Less Than 80%)' WHEN 'Availability to Allocation Hours %’ is less than 80. Allocation Compliance is 'Appropriately Allocated (Between 80-120%)' WHEN 'Availability to Allocation Hours %' is between 80 and 120. Allocation Compliance is 'Over Allocated (Over 120%)' WHEN 'Availability to Allocation Hours %' is greater than 120. User can further narrow their search by Resource Is Active?, OBS Type, OBS Path, Allocation Start Date, Investment Name and Resource Manager. User can use exact dates or relative dates for Allocation Start Date filter parameter.
 -
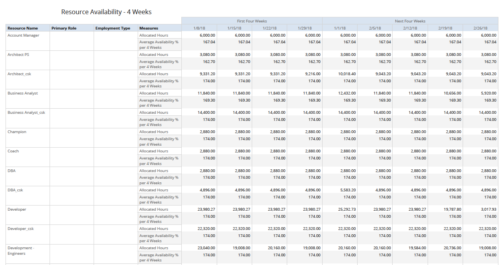 Resource Availability – 4 Weeks displays all resources with their total allocated hours by week, and an average availability percent (4 Wk Avail %) for next four weeks. This report also displays Resource Primary Role and Employment Type. User can further narrow their search by Resource Name, Resource Type & Week Start Date. User can use exact dates or relative dates for Week Start Date filter parameters.
 -
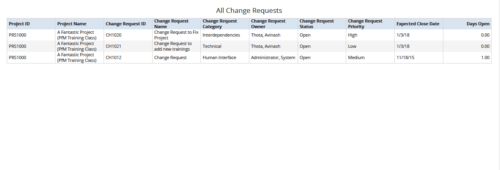 All Change Requests report provides the project manager a single place to view change requests across multiple projects. This report displays Project Information such as ID & Name, Change Request Information such as its ID, Name, Category, Owner, Status, Priority, Expected Close Date and Days Open. You can further narrow your search by OBS Type & Path, Change Request Status, Change Request Name, Change Request Category, Change Request Owner, Project Name and Project Manager.
 -
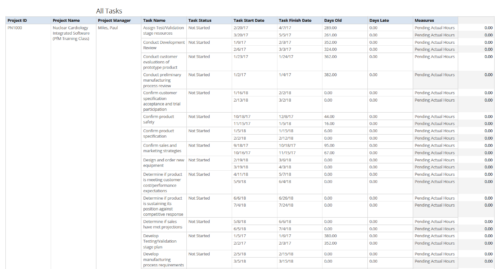 All Tasks report provides the Project Managers a single place to view all the tasks associated with a project(s). User can view only the investments that he has access. Project Managers can use this report to view the progress of the tasks and check how the tasks are performing against baseline date. User can further narrow their search by OBS Type & Path, Investment Name, Month Start Date and Is Project Active?.
 -
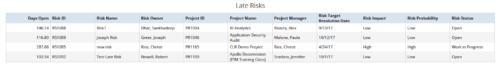 All Risks report provides the project manager a single place to view risks across multiple projects. This report displays Project Information such as ID, Name & Manager, Risk Information such as its ID, Name, Owner, Status, Probability, Impact, Target Resolution Date & Days Open. You can further narrow your search by Risk Status, Risk Name Risk Impact, Risk Owner, Project Name and Project Manager.
 -
 Late Milestones report displays the list of all milestones that are not closed but are past their finish date or past their baseline finish date. The report provides Project Manager the ability to view and track late milestones across multiple projects without going into each project individually. This report displays Project ID, Project Name, Project Manager, Milestone Name, Due Date, Baseline Date, Days Late (Elapsed days between Task Finish date and Task Baseline Finish date), and Days Old (Elapsed days between Task Finish Date and Today's Date). User can further narrow their search by Project ID, Project Name, Project Manager Name, Milestone Name, Due Date between, Baseline Date between, Is Milestone?, Is late?, Task Status, Is Template?. User can use exact dates or relative dates for Due Date between and Baseline Date between filter parameters.
 -

 Pie Chart displays projects by Baseline Finish Variance—is current project finish beyond baseline finish; or is current project finish on or before baseline finish. Filterable by OBS structure and Finish Date range. Data labels show percent within baseline vs percent outside baseline. Mouse-over shows Within or Outside label and percent of total projects. Legend shows color coded Within Baseline and Outside Baseline labels. Drilldown: Clicking on a pie slice yields a grid portlet of projects either Within or Outside Baseline.
 -
 A slide deck from Rego’s training class on Portfolio Management using Clarity’s Classic UX. Covers an introduction to Portfolio Management including definition, portfolio contents, PfM roles and responsibilities, how portfolios work, data used, key deliverables, prerequisites for starting PfM, and PfM security.
 -
 A Quick Reference Guide to assist in creating a project from a template in Clarity’s Classic UX. Document uses screen shots to walk through the process. Document uses the Phoenix Theme.
 -
 A Quick Reference Guide to assist in the creation of risks, issues and change requests in Clarity. The document show this with screenshots from the Classic UX with the Phoenix theme.
 -
 A Quick Reference Guide to assist with the creating and managing of Cost Plans in Clarity. The document uses screen shots from the Classic UX using the Phoenix theme.
 -
 This training document is a Rego Consulting Quick Reference Guide to assist with General Navigation in Clarity’s Modern User Experience. This doc references version 16.0.2 views. Doc reviews the Menu Bar and User Tool Bar.


Copyright 2023 • Rego Consulting Corporation • Privacy Policy