-
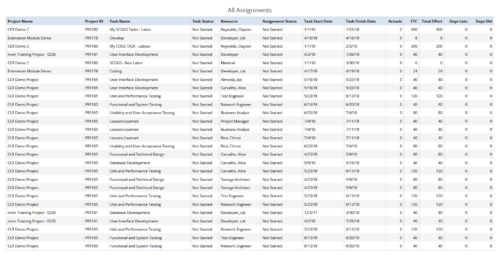 All Assignments report provides the Managers a single place to view all the assignments associated with a project(s). User can view only the investments that he has access to. This report also displays ETC, Actuals, Total Effort, Days Old (Elapsed days between Task Finish Date and Today's Date), Days Late (Elapsed days between Task Finish date and Task Baseline Finish date) associated with the task. You can further narrow your search by OBS Type & Path, Resource Name , Project Manager, Project Name, Project ID, Is project Active?, Assignment Start Date, Assignment Finish Date, Assignment Status and Task Status.
 -
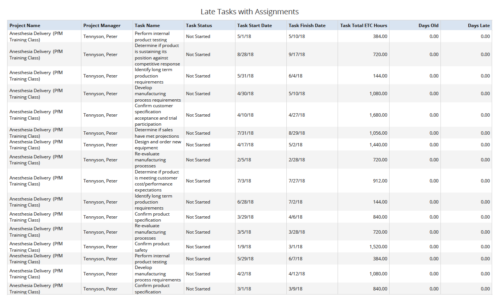 Late Tasks with Assignments report displays the list of all Tasks (with their Total ETC Hours) that are not closed but are past their finish date or past their baseline finish date. The report provides Project Manager the ability to view and track late tasks across multiple projects without going into each project individually. This report displays Project Name, Project Manager, Task Name, Task Status, Task Start Date, Task Finish Date, Days Old (Elapsed days between Task Finish Date and Today's Date), Days Late (Elapsed days between Task Finish date and Task Baseline Finish date). User can further narrow their search by Task Name, Task Status, Project ID, Project Name, Project Manager, Is Milestone?, Is late?, Task Start Date, Task Finish Date and Is Template?. User can use exact dates or relative dates for Task Start Date and Task Finish Date filter parameters.
 -
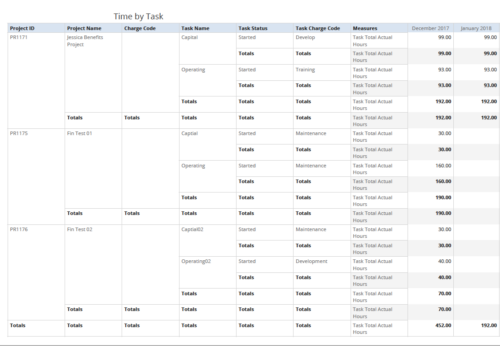 Time by Task report displays monthly time logged to Tasks for all filtered investments. It also displays total Actual hours associated with a task. User can further narrow their search by OBS Type & Path, Charge Code, Project Name, Task Name, Task Charge Code, Task Status and Month End Date. User can use exact dates or relative dates for Month End Date filter parameters.
 -
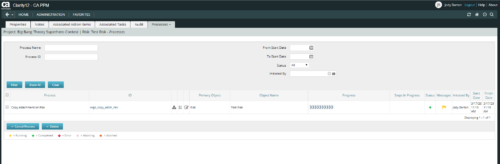 This is workflow that allows you to copy documents from one item to another. This can be altered to move documents from any place they are stored to another. In this particular instance, the focus is on moving documents from one risk to another. When creating a risk that you want to copy from, utilize the attachments section of the page and the associated lookup. The lookup is filtered to only show those risks that already have documents associated with them. Upon clicking the save button, a process runs in the background to copy the requested documents from the requested risk to this newly created risk.
 -
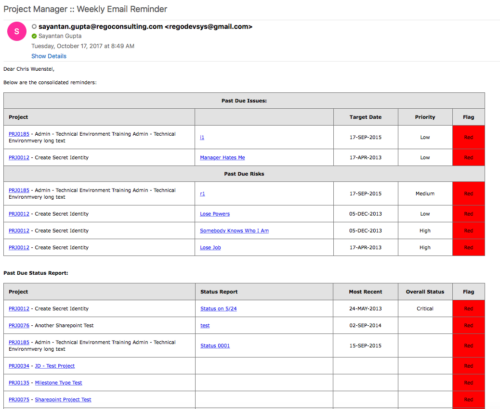 A process that:
- is a weekly email to a project manager. All of the content will be for where the person getting the email is the PM
- shows aggregate data for all of their projects
- sends the PM a reminder email at the end of each week showing the items that the PM needs to do. Maybe call it Weekly PM reminder.
- Shows the mentioned data in sections as follows:
- Past Due issues
- Only active projects
- Only open issues – not resolved or closed
- Show project name, project ID, issue name, issue priority, target resolution date, color (only red or yellow)
- Logic for Yellow = where target resolution is within the next week
- Logic for Red = target resolution date is in the past
- URL LINK: to that issue
- Past Due Risks
- Only active projects
- Only open risks – not resolved or closed
- Show project name, project ID, risk name, risk priority, target resolution date, color (only red or yellow)
- Logic for Yellow = where target resolution is within the next week
- Logic for Red = target resolution date is in the past
- URL LINK: to that risk
- Past Due Status Report
- Only active projects
- Show project name, project ID, report date, most recent overall status, color (only red or yellow)
- Only 1 line per project – show even if there is no status report
- Logic for Yellow = where latest status report date > 7 days ago
- Logic for Red = latest status report date is > 14 days ago
- URL LINK: to status report list
- Past Due Milestones
- Only active projects
- Only open milestones
- Show project name, project ID, task name, task finish date, color (only red or yellow)
- Logic for Yellow = where finish is within the next week
- Logic for Red = finish date is in the past
- URL LINK: to that milestone
- Past Due Forecast
- Only active projects
- Show project name, project ID, last updated date, most recent total plan of record amount, color (only red or yellow)
- Only 1 line per project – show even if there is no finish plan
- Logic for Yellow = where last updated date of the plan of record > 14 days ago
- Logic for Red = where last updated date of the plan of record > 30 days ago
- URL LINK: to cost plan
- Allocation Summary for the Project Team
- Past Due issues
- Unfilled Roles that need to be staffed
- Resources Actuals +/- 25% of Allocation
- Resource ETC +/- 25% of Allocation
- Pending Change Controls / Approval Status
- In addition to the Past Due Milestones, upcoming milestones
- Budget Summary
- Actual vs. Planned
- Burndown estimate
-
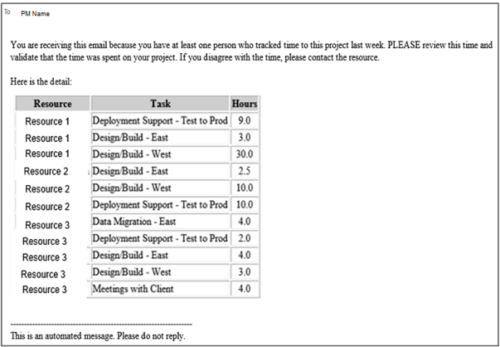 This process pulls in the total hours tracked, by resource, by task, for a given project for the weekly time period that ended. The information is sent to the Project Manager listed on the project. This process can be scheduled via the Execute a Process job.
 -
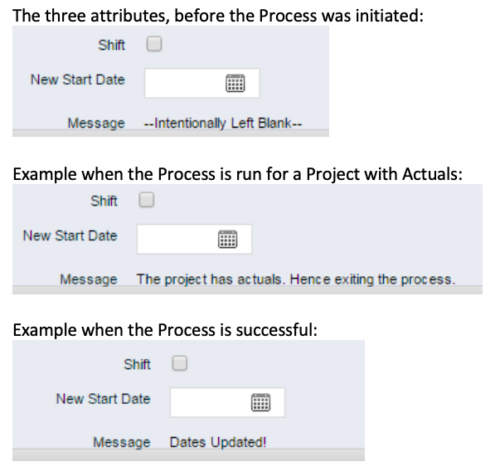 This process, Shift Project Dates, helps Project Managers change an entire Project / Idea’s dates to a new start date. Once the three attributes are added to the Idea /Project Views, the PM can trigger the process by entering a date in the New Start Date field and checking the Shift checkbox. The process runs automatically on Save. The process calculates the date difference between the original Start Date and New Start Date then shifts all Allocation, Task, and Assignment dates by the calculated difference. For example, if a Project is set to begin on January 1st and needs to be pushed to a February 1st start date, the process first determines that there are 31 days between the original start date and the new date. Next the process increases the start date for each Task, Allocation and Assignment by 31 days. NOTE: The process will shift Allocation dates regardless of resource restrictions such as a Termination Date or non-working time as marked on their calendar. The Team page will reflect the Available Start and Finish as shifted by the process, but the Allocation hours and % will take unavailable time into account. For example, if a shift process sets the start date for a resource to be after their date of termination the dates will change by the date difference, but the Allocation hours will correctly be calculated as zero.
 -
 The Timesheet Approval - RM and PM process is an auto-start process that begins once the resource submits his or her timesheet. This process provides a checks-and-balances style to ensure that all resources entering time have entered the 40 hours. Once the timesheet is submitted, the process will lock the user’s timesheet to prevent editing. The process will then select the next action based on three different factors:
- The timesheet has less than 40 hours.
- The timesheet has 40 or more hours.
- The resource’s availability is less than 8hrs/day.
-
 Looking for more value in Open Workbench? Learn tricks to decrease the time you spend on project management, as well as best practices around plans, baselines, and dependencies.
 -
 Are you starting a demand/portfolio management implementation, or do you want to compare how you are using these functions vs. others or best practices? In this class we will discuss some best practices from successful customers.
 -
 Course Description: Do you want to analyze the cost and utilization of Agile development resources? Do you struggle to integrate financial information with work execution information from Agile tools such as Rally Software®, Jira, or VersionOne? This session explores reporting and dashboarding approaches to provide technology leaders with KPIs and trends for Agile execution, along with views that relate Agile team activity with cost and delivery.
 -
 Course Description: Are your project teams using SharePoint effectively and getting the most value out of it? Is document management a daily struggle? Learn how to use SharePoint with Clarity PPM to seamlessly improve collaboration and team productivity.


Copyright 2023 • Rego Consulting Corporation • Privacy Policy