-
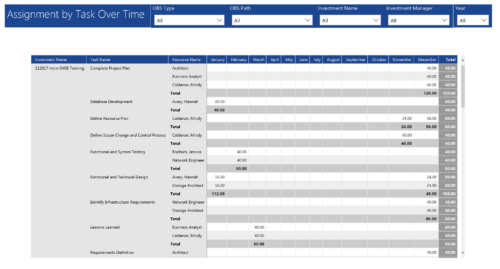 Assignments by Task Over Time report display all assignments by task for all resources. Information is displayed on monthly basis. This report displays Investment Name, Task Name, Resource Name and its monthly assignments. You can further narrow your search by OBS Type & Path, Investment Manager, Investment Name, and Year
 -
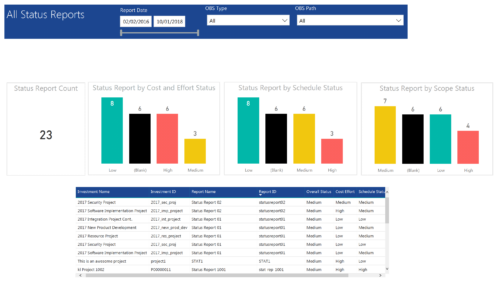 All Status report provides project managers a single place to view KPIs related to Status Reports. All the KPIs are depicted in various visualizations. Status Report Count: Scorecard that displays the # of Status Reports for the selected criteria. Status Report by Cost Effort Status: Column chart that displays # of Status Reports by Cost Effort. X axis displays various Cost Effort Status. Data labels indicate the number of Status Reports associated with that category. Status Report by Schedule Status: Column chart that displays # of Status Reports by Schedule Status. X axis displays various Schedule statuses. Data labels indicate the number of Status Reports associated with that status. Status Report by Scope Status: Column chart that displays # of Status Reports by Scope Status. X axis displays various Scope statuses. Data labels indicate the number of Status Reports associated with that status. Grid: Displays Status Report details such as Investment ID, Investment Name, Report Name, Report ID, Overall Status, Cost Effort, Schedule Status and Scope Status. You can further narrow your search by OBS Type, OBS Path and Report Date range
 -
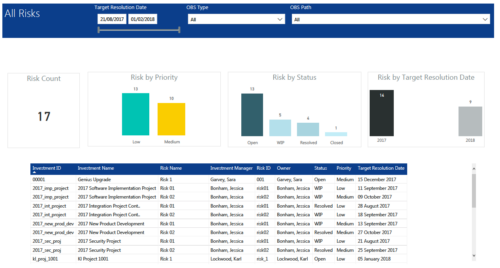 All Risks report provides project managers a single place to view KPIs related to Risks. All the KPIs are depicted in various visualizations. Risk Count: Scorecard that displays the # of Risks for the selected criteria. Risk Priority: Column chart that displays # of Risks by Priority. X axis displays various Risk Priorities. Data labels indicate the number of Risks associated with that category. Risk by Status: Column chart that displays # of Risks by Status. X axis displays various Risk statuses. Data labels indicate the number of Risks associated with that status. Risk by Target Resolution Date: Column chart that displays # of Risks by year of Target Resolution Date. X axis displays Year. Data labels indicate the number of Risks associated with that category. Grid: Displays Risk details such as Investment ID, Investment Name, Investment Manager, Risk ID, Risk Name, Owner, Status, Priority and Target Resolution Date. You can further narrow your search by OBS Type, OBS Path and Target Resolution Date range.
 -
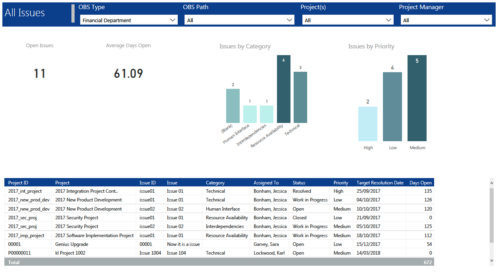 All Issues report provides project managers a single place to view KPIs related to Issues. All the KPIs are depicted in various visualizations. Open Issues: Scorecard that displays the # of Issues that are not closed or resolved. Average Days Open: Scorecard that displays the # of days on an average an issue is in open state. Issue category: Column chart that displays # of Issues by category. X axis displays various Issue categories. Data labels indicate the number of Issues associated with that category. Issue Priority: Column chart that displays # of Issues by priority. X axis displays various Issue priority. Data labels indicate the number of Issues associated with that priority. Grid: Displays Issue details such as Project ID, Project, Issue ID, Issue, Category, Assigned To, Status, Priority, Target Resolution Date and Days Open. You can further narrow your search by OBS Type, OBS Path, Project(s) and Project Manager.
 -
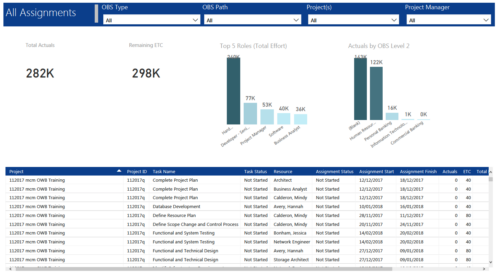 All Assignments report provides project managers a single place to view KPIs related to Task Assignments. All the KPIs are depicted in various visualizations. Total Actuals: Scorecard that displays the sum of actuals associated with assignments for the selected criteria. Remaining ETC: Scorecard that displays the sum of current ETC associated with assignments for the selected criteria. Top 5 Roles (Total Effort): Column chart that displays Effort (Actuals + ETC) by Roles. X axis displays various Roles. Data labels indicate sum of effort associated with that Role. Actuals by OBS level 2: Column chart that displays Actuals by OBS level 2. X axis displays various OBS level 2. Data labels indicate sum of actuals associated with that OBS. Grid: Displays Assignment details such as Project ID, Project Name, Task Name, Task Status, Assigned Resource, Assignment Status, Assignment Start, Assignment Finish, Actuals, ETC, Total Effort, Days Late and Days Old. You can further narrow your search by OBS Type, OBS Path, Project(s) and Project Manager.
 -
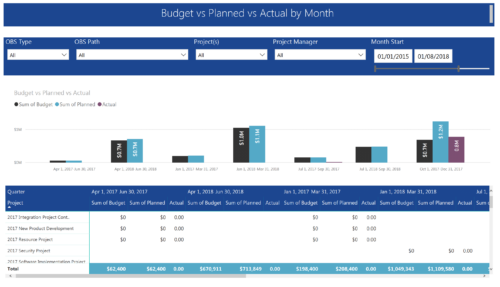 Project Budget vs Planned vs Actual by Month report provides the Project Managers a single place to view Project Budget, Planned and Actual Cost for multiple projects. This report displays Project Budget vs Planned vs Actual by Month in the form of clustered bar chart over a period of time. User can further drill down the information to investment level by selecting a particular bar within the chart. User can further narrow their search by OBS Type & Path, Project(s), Project Manager, Month Start and End Date.
 -
 Project Manager- Resource/Compliance report provides project managers a single place to view Compliance status for various critical KPIs. All the KPIs are depicted in various visualizations.
- Unfilled Demand: Donut chart that gives you the count of roles (within projects) that are not filled by resources.
- # Of New team members: Scorecard that displays the count of new team members added to the projects.
- Resource Constraints: Donut chart that gives you the count of Over utilized and underutilized resources
- Unsubmitted Time: Dial gauge that displays the count of resources that did not submit time.
- Stale Tasks: Dial gauge that displays the count of tasks that are past their due date
- Status Report Compliance: Dial gauge that displays the compliance of status reports for various projects.
-
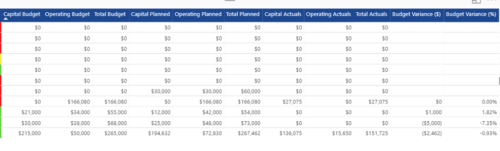
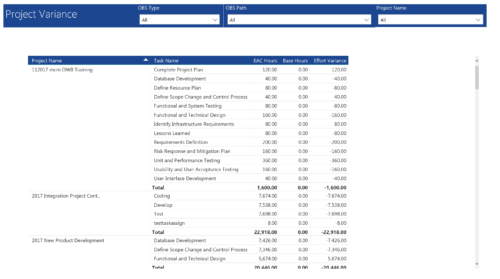 Project Variance report provides project managers a single place to view all their active projects, open tasks, Task EAC hours, Task Baseline hours and their variance. Project Managers can use this report to view and manage their projects progress against their baselines. They can easily detect the projects that are running behind and pinpoint the tasks that are causing the variance in the schedule. You can further narrow your search by OBS Type, OBS Path and Project.
 -
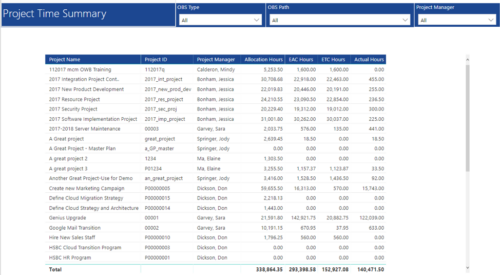 Project Time Summary report provides view of Allocation hours, EAC hours, ETC hours and Actual hours for Projects. User can further narrow their search by OBS Type & Path and Project Manager.
 -
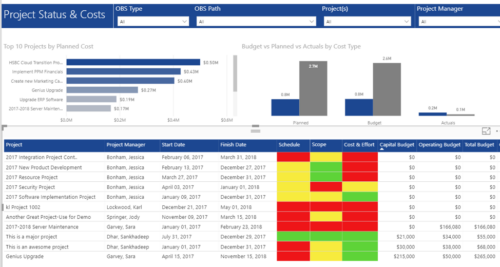 Project Status and Costs report has the details of the Project Schedule, Scope, Cost and Effort Statuses along with Planned, Budget & Actuals costs. There is also graphical representation that shows Top 10 projects by Planned Cost, Budget vs Planned vs Actuals by Cost Type. User can further narrow their search by OBS Type & Path, Project(s) and Project Manager.
 -
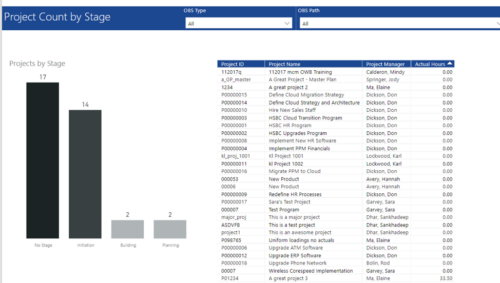 Project Count by Stage report has Stacked Column chart that displays count of Projects by Stage such as Initiation, Building, Planning etc. Also, there is a table view with Project ID, Project Name, Project Manager and Actual hours details. User can further narrow their search by OBS Type & Path.
 -
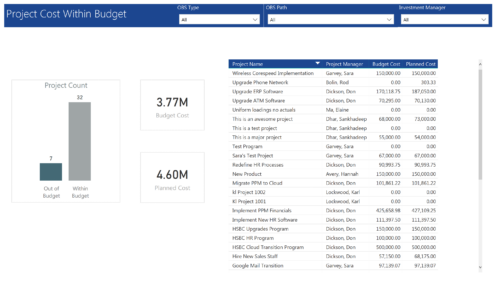 Project Cost within Budget report displays count of projects that are within or exceeding budget in the form of a bar chart. It also displays Total budget cost and Planned cost. User can further drill down the details to investment level. You can further narrow your search by OBS Type & Path and Investment Manager.


Copyright 2023 • Rego Consulting Corporation • Privacy Policy