-
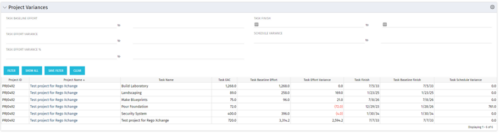 This Project Variances portlet provides a project manager a consolidated view of all of their active projects and open project tasks and shows them the baseline variance for the task EAC’s and the task start and finish dates. This gives the project manager a single place to view and manage how their projects are progressing against their baselines. The PM can easily detect when projects are running behind and pinpoint which tasks are causing the variance in the schedule.
 -
This Project Variances portlet provides a project manager a consolidated view of all of their active projects and open project tasks and shows them the baseline variance for the task EAC’s and the task start and finish dates. This gives the project manager a single place to view and manage how their projects are progressing against their baselines. The PM can easily detect when projects are running behind and pinpoint which tasks are causing the variance in the schedule.
-
 This configuration and accompanying process allows users to capture Financial and Non-Financial (Metrics, Soft, etc.) Benefit in a custom sub-object, then programmatically create an out-of-the-box Benefit Plan with just the Financial Portion from the custom sub-object. The solution is comprised of:
- Sub-Object (Benefit Plan Details, Parent = Project)
- Process: Create Benefit Plan (uses sub-object as primary input, native BP is output)
- Process: Update sql - Cost Benefit Plans (one-time script to update Projects)
- Ensure on the Benefit Details List view the Planned and Realized Amounts are displayed
- Modifying the Create Benefit Plan Process in support of a BP naming convention consistent with local PMO Practices
- Modifying the Create Benefit Plan Process to link the BP to the Cost Plan of Record
- Creating a Portlet that pulls together rows of data from the sub-object across multiple projects in a summarized view as well as a detailed view
-
This configuration and accompanying process allows users to capture Financial and Non-Financial (Metrics, Soft, etc.) Benefit in a custom sub-object, then programmatically create an out-of-the-box Benefit Plan with just the Financial Portion from the custom sub-object. The solution is comprised of:
- Sub-Object (Benefit Plan Details, Parent = Project)
- Process: Create Benefit Plan (uses sub-object as primary input, native BP is output)
- Process: Update sql - Cost Benefit Plans (one-time script to update Projects)
- Ensure on the Benefit Details List view the Planned and Realized Amounts are displayed
- Modifying the Create Benefit Plan Process in support of a BP naming convention consistent with local PMO Practices
- Modifying the Create Benefit Plan Process to link the BP to the Cost Plan of Record
- Creating a Portlet that pulls together rows of data from the sub-object across multiple projects in a summarized view as well as a detailed view
-
 This portlet displays Actual Time by Project over a span of time. It supports Annual, Quarterly, Monthly, and Weekly time periods. The time span displayed is controlled by a filter field for the Start Date (of the time span) and by a filter field for the Number of Time Periods to be displayed. There are also filters for Project name, Project Manager, and Project Type.
 -
This portlet displays Actual Time by Project over a span of time. It supports Annual, Quarterly, Monthly, and Weekly time periods. The time span displayed is controlled by a filter field for the Start Date (of the time span) and by a filter field for the Number of Time Periods to be displayed. There are also filters for Project name, Project Manager, and Project Type.
-
 Part of the Business Transformation Content collection, this bar chart portlet displays count of ideas per business unit. This provides a holistic view of the idea pipe-line in an organization providing them a high-level of ideas converted, approved, unapproved per business unit.
 -
Part of the Business Transformation Content collection, this bar chart portlet displays count of ideas per business unit. This provides a holistic view of the idea pipe-line in an organization providing them a high-level of ideas converted, approved, unapproved per business unit.
-
 Are you considering or analyzing PMO value metrics? This class is a working session will cover lessons learned in PMOs, so you can craft guiding metrics, with or without a tool.
 -
 Horizontal Bar Graph displays total number of projects for each Business Owner/Sponsor for a selected Project Parent Stage (only Project Investments included). Vertical Axis displays Business Owner name. Horizontal Axis displays number of projects. Filter selectable for any Project Parent Stage. Color coding of bar and legend are synchronized to detail stage under the parent. Total for each detail stage displays on each segment of the bar. A mouseover displays a percent of total for each detail stage.
 -
Horizontal Bar Graph displays total number of projects for each Business Owner/Sponsor for a selected Project Parent Stage (only Project Investments included). Vertical Axis displays Business Owner name. Horizontal Axis displays number of projects. Filter selectable for any Project Parent Stage. Color coding of bar and legend are synchronized to detail stage under the parent. Total for each detail stage displays on each segment of the bar. A mouseover displays a percent of total for each detail stage.
-
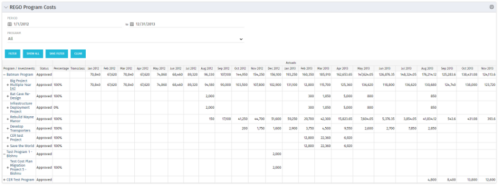 The Program Costs portlet looks like a cost plan. It will summarize all cost plans from projects within the program and display the totals.
 -
The Program Costs portlet looks like a cost plan. It will summarize all cost plans from projects within the program and display the totals.
-
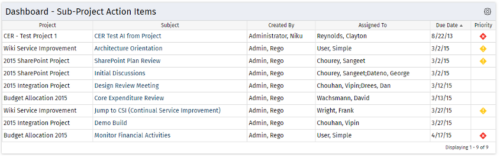 The Program Dashboard Sub Project Action Items portlet display Action Items of Sub Projects in a Program. The portlet will pull the "Action Items" from all the sub projects in the Program, and this information is placed on the Dashboard tab. This portlet displays each Project, name of the Action Item as mentioned in the Subject, and the resource who Created this Action Item. Assigned To field will display the resource to whom the Action Item has been Assigned. Due Date mentions the date the Action Item will be completed and the Priority level of the Action Item is a stoplight showing red, yellow and green for the different levels of priority. The table below describes the available columns in the portlet. The first 6 are configured in the default view:
Column Label Description Project Name of the Project Subject Defines the name for Action Item Created By Resource who created the Action Item Assigned To Resource who the Action Item is Assigned to Due Date Date the Action Item is due for completion Prty Specifies the priority level of the Action Item Action Item ID Internal ID used by the query Created By ID Internal ID used by the query Created Date Date the Action Item was created Days Open No. of days the Status of Action Item has remained opened since it was created Priority Name Based on high, medium, or low priority with corresponding red, yellow, or green stoplights Project DB ID Internal ID used by the query Project ID Unique ID of the Project within Clarity Project Manager Project Manager -
The Program Dashboard Sub Project Action Items portlet display Action Items of Sub Projects in a Program. The portlet will pull the "Action Items" from all the sub projects in the Program, and this information is placed on the Dashboard tab. This portlet displays each Project, name of the Action Item as mentioned in the Subject, and the resource who Created this Action Item. Assigned To field will display the resource to whom the Action Item has been Assigned. Due Date mentions the date the Action Item will be completed and the Priority level of the Action Item is a stoplight showing red, yellow and green for the different levels of priority. The table below describes the available columns in the portlet. The first 6 are configured in the default view:
Column Label Description Project Name of the Project Subject Defines the name for Action Item Created By Resource who created the Action Item Assigned To Resource who the Action Item is Assigned to Due Date Date the Action Item is due for completion Prty Specifies the priority level of the Action Item Action Item ID Internal ID used by the query Created By ID Internal ID used by the query Created Date Date the Action Item was created Days Open No. of days the Status of Action Item has remained opened since it was created Priority Name Based on high, medium, or low priority with corresponding red, yellow, or green stoplights Project DB ID Internal ID used by the query Project ID Unique ID of the Project within Clarity Project Manager Project Manager -
 Out of the box, there is no way to export or report on the Modern UX Roadmap Grid view. This report allows the end user to select one or more roadmaps and provides an exportable view of several OOTB fields from those roadmaps. When exported to and open in excel, the first tab will display a combined view of all selected Roadmaps, one row for every Roadmap Item, and additional tabs will display Roadmap-specific views. Custom attributes may be added to the report by your developers.
 -
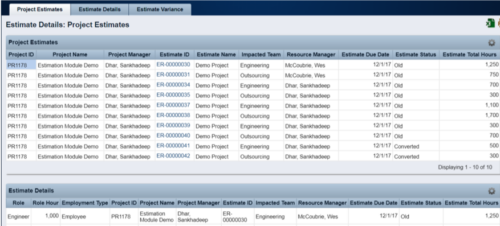 The Rego Estimation Module Provides a more accurate estimate earlier in the idea/project lifecycle.
- Is applied consistently so it can be improved.
- Retains the data in Clarity to enable analysis.
- Provides ongoing feedback by comparing estimates to current EAC.
- Provides historical record of estimating for projects overall as well as change requests.
-
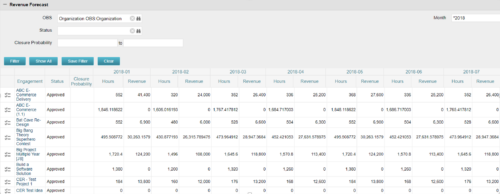
The Revenue Forecast portlet displays projected revenue at a project level broken out by month. This portlet assists in viewing all project revenue data at once and making it easily exportable. The table below describes the available filter fields in the portlet. Column Label Description OBS OBS to filter projects with Status Status of the project Closure Probability ? Months Month(s) of Project Revenue to display -
The Revenue Forecast portlet displays projected revenue at a project level broken out by month. This portlet assists in viewing all project revenue data at once and making it easily exportable. The table below describes the available filter fields in the portlet. Column Label Description OBS OBS to filter projects with Status Status of the project Closure Probability ? Months Month(s) of Project Revenue to display -
 Part of the Business Transformation collection, this grid portlet displays idea details for all ideas (active and inactive) and all status conditions. This is an editable portlet based on the Ideas data provider. Filterable by OBS structure, Active/Inactive, and Status.
 -
Part of the Business Transformation collection, this grid portlet displays idea details for all ideas (active and inactive) and all status conditions. This is an editable portlet based on the Ideas data provider. Filterable by OBS structure, Active/Inactive, and Status.
-
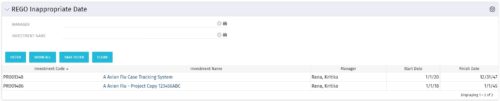 This grid portlet to show projects with finish or start date of project more than 20 years in future or past. The portlet automatically displays results when accessed. The user can apply filters to fetch the desired information.
 -
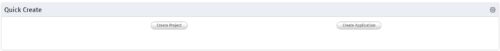 An HTML portlet that displays two buttons that link the user instantly to an object create page. The portlet comes with two buttons and the buttons can be modified to link to any creation page. Administrator can choose: Project, Idea, Application, Program, etc.


Copyright 2023 • Rego Consulting Corporation • Privacy Policy