-
 This portlet shows the variance between the budgeted cost and the planned cost for projects. This allows for the variance to be displayed between what was planned and what was approved. This provides the PMs with the ability to better plan the costs.
 -
This portlet shows the variance between the budgeted cost and the planned cost for projects. This allows for the variance to be displayed between what was planned and what was approved. This provides the PMs with the ability to better plan the costs.
-
This portlet shows the variance between the budgeted cost and the planned cost for projects. This allows for the variance to be displayed between what was planned and what was approved. This provides the PMs with the ability to better plan the costs.
-
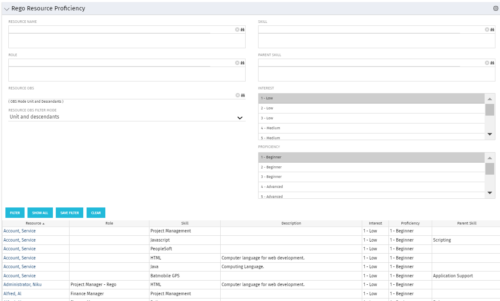 This grid displays Skill Proficiency and Interest Level by Resource. Users can utilize this view to search for Resources by Skill, Parent Skill, Interest, Role, Parent Role, Resource and Resource OBS. This portlet grants a Project Manager or Resource Manager the ability to determine which Resources best fit the needs for their project.
 -
This grid displays Skill Proficiency and Interest Level by Resource. Users can utilize this view to search for Resources by Skill, Parent Skill, Interest, Role, Parent Role, Resource and Resource OBS. This portlet grants a Project Manager or Resource Manager the ability to determine which Resources best fit the needs for their project.
-
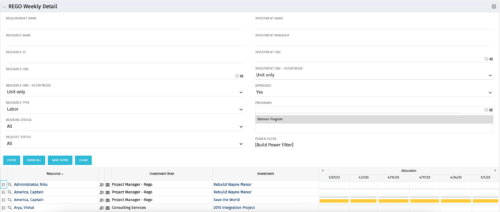 This is the same portlet as the out of the box Weekly Detail with an additional filter element for Program (multiple select). Portlet displays resource allocations graphically for each project in the specified program(s), for the next six weekly periods. Portlet filterable by numerous project, resource, and assignment attributes. Graphical representation shows Resource Availability Threshold and Allocation in hours, as a mouse-over.
 -
This is the same portlet as the out of the box Weekly Detail with an additional filter element for Program (multiple select). Portlet displays resource allocations graphically for each project in the specified program(s), for the next six weekly periods. Portlet filterable by numerous project, resource, and assignment attributes. Graphical representation shows Resource Availability Threshold and Allocation in hours, as a mouse-over.
-
 “Resources with No Basic Matrix Entry” portlet displays combinations of project and resource where the assigned resource does or does not have a rate established for that project. Portlet is filterable by Projects, Project ID, Resources, and Missing Rate (Yes, No, All). How does this work? The Rate Matrix Extraction job populates a record into the NBI_PROJ_RES_RATES_AND_COSTS table for every resource/project combination that meets any of the rate matrix criteria. This portlet checks that table, and sets the Missing Rate attribu
 -
“Resources with No Basic Matrix Entry” portlet displays combinations of project and resource where the assigned resource does or does not have a rate established for that project. Portlet is filterable by Projects, Project ID, Resources, and Missing Rate (Yes, No, All). How does this work? The Rate Matrix Extraction job populates a record into the NBI_PROJ_RES_RATES_AND_COSTS table for every resource/project combination that meets any of the rate matrix criteria. This portlet checks that table, and sets the Missing Rate attribu
-
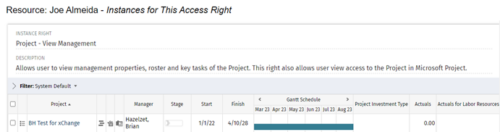
 This process grants Project Management instance rights to all of the project team members within the program hierarchy. Allows users to view management properties, roster and key tasks of the project. This also allows user view access to the project in Microsoft Project.
 -
This process grants Project Management instance rights to all of the project team members within the program hierarchy. Allows users to view management properties, roster and key tasks of the project. This also allows user view access to the project in Microsoft Project.
-
This process grants Project Management instance rights to all of the project team members within the program hierarchy. Allows users to view management properties, roster and key tasks of the project. This also allows user view access to the project in Microsoft Project.
-

 The portlet shows the project spend to vendors by month. The Vendor field picked on the portlet comes from the Vendor mentioned when creating the voucher (as displayed on the first screenshot). This provides a nice view of identifying how much is spent by an organization on the vendor employees on their workforce.
 -
The portlet shows the project spend to vendors by month. The Vendor field picked on the portlet comes from the Vendor mentioned when creating the voucher (as displayed on the first screenshot). This provides a nice view of identifying how much is spent by an organization on the vendor employees on their workforce.
-
 The portlet shows the Overall Status and Budget Status and Amounts. It displays one row per project. The portlet shows the following main fields: Overall Status, Budget Status, Capital Budget, Operating Budget, Total Budget, Capital Planed, Operating Planned, Total Planned, Capital Actuals, Operating Actuals, Total Actuals, Budget Variance ($), Budget Variance (%) Displaying the budget variance allows the PM to understand of the project is over / under spent, and thus the costs planning needs to be re-visited.
 -
The portlet shows the Overall Status and Budget Status and Amounts. It displays one row per project. The portlet shows the following main fields: Overall Status, Budget Status, Capital Budget, Operating Budget, Total Budget, Capital Planed, Operating Planned, Total Planned, Capital Actuals, Operating Actuals, Total Actuals, Budget Variance ($), Budget Variance (%) Displaying the budget variance allows the PM to understand of the project is over / under spent, and thus the costs planning needs to be re-visited.
-
 Part of the Business Transformations collection, this portlet displays planned revenue as defined by a project whose goal is "Grow the business". It uses the Planned Revenue Query as a data provider. This portlet provides a holistic overview of how many projects following the goal “Grow the Business” are Critical/ At Risk / On Track with regard to the planned revenue.
 -
Part of the Business Transformations collection, this portlet displays planned revenue as defined by a project whose goal is "Grow the business". It uses the Planned Revenue Query as a data provider. This portlet provides a holistic overview of how many projects following the goal “Grow the Business” are Critical/ At Risk / On Track with regard to the planned revenue.
-
 Part of the Business Transformation collection, this portlet displays count of the planned benefits (savings) per project manager. It also displays if any of the planned benefits are Critical/ At Risk / On Track, along with the total planned benefit amount.
 -
Part of the Business Transformation collection, this portlet displays count of the planned benefits (savings) per project manager. It also displays if any of the planned benefits are Critical/ At Risk / On Track, along with the total planned benefit amount.


Copyright 2023 • Rego Consulting Corporation • Privacy Policy