-
 Part of the Business Transformation collection, this portlet displays count of the planned benefits (savings) per project manager. It also displays if any of the planned benefits are Critical/ At Risk / On Track, along with the total planned benefit amount.
 -
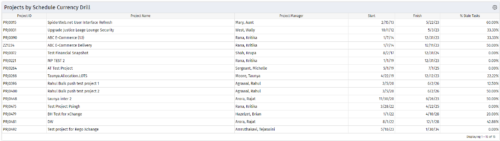
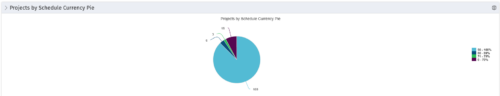 Pie Chart Portlet displays counts of active projects with various Stale ratings. Calculation is Percent Stale Tasks = number of open (not completed) tasks with a finish date over 15 days old, divided by total open tasks. Filterable by OBS structure and project manager. Data label = project count. Mouse-over and Legend labels = stale rating. More than 90% Stale means 90 to 100% of open tasks on a project have finish dates older than 15 days. More than 80% Stale means 80 to 89% of open tasks on a project have finish dates older than 15 days. Less than 70% Stale means fewer than 70% of open tasks on a project have finish dates older than 15 days. By clicking on pie slice, a drilldown grid portlet appears with listing of projects and their Stale Ratings.
 -
Pie Chart Portlet displays counts of active projects with various Stale ratings. Calculation is Percent Stale Tasks = number of open (not completed) tasks with a finish date over 15 days old, divided by total open tasks. Filterable by OBS structure and project manager. Data label = project count. Mouse-over and Legend labels = stale rating. More than 90% Stale means 90 to 100% of open tasks on a project have finish dates older than 15 days. More than 80% Stale means 80 to 89% of open tasks on a project have finish dates older than 15 days. Less than 70% Stale means fewer than 70% of open tasks on a project have finish dates older than 15 days. By clicking on pie slice, a drilldown grid portlet appears with listing of projects and their Stale Ratings.
-
 Part of the Business Transformation collection, this pie chart portlet displays realized benefit, grouped by location of project. This provides the PM with a holistic view of benefits realized across the geographical locations.
 -
Part of the Business Transformation collection, this pie chart portlet displays realized benefit, grouped by location of project. This provides the PM with a holistic view of benefits realized across the geographical locations.
-
 Part of the Business Transformation collection, this line chart portlet displays realized vs planned benefits overtime, for portfolio investments. This provides the PfM with a holistic view of benefits planned vs realized over a period of time.
 -
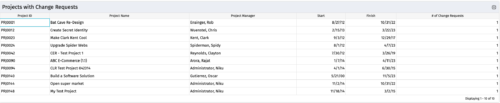
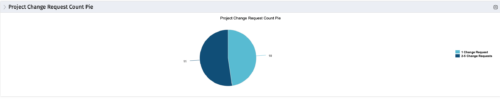 The portlet, Project Change Request Count Pie with drill-down is a simple pie that displays the total count of projects in the pie. The slices are:
- Projects with 0 change requests
- Projects with 1 change request
- Projects with 2-5 change requests
- Projects with 5-10 change requests
- Projects with over 10 change requests
-
The portlet, Project Change Request Count Pie with drill-down is a simple pie that displays the total count of projects in the pie. The slices are:
- Projects with 0 change requests
- Projects with 1 change request
- Projects with 2-5 change requests
- Projects with 5-10 change requests
- Projects with over 10 change requests
-
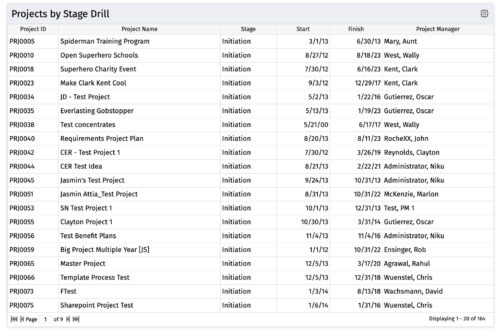
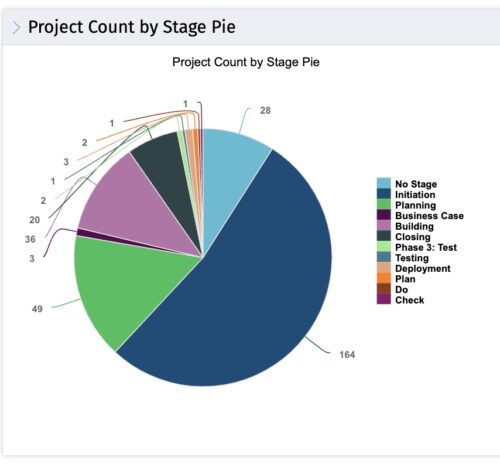 The portlet, Count by Stage with Drilldown is a simple pie based on stage OOTB field. The drill down portlet has stage as a column. Clicking on any of the segments, e.g. Initiation, redirects to the Projects by Stage Drill portlet.
 -
The portlet, Count by Stage with Drilldown is a simple pie based on stage OOTB field. The drill down portlet has stage as a column. Clicking on any of the segments, e.g. Initiation, redirects to the Projects by Stage Drill portlet.
-
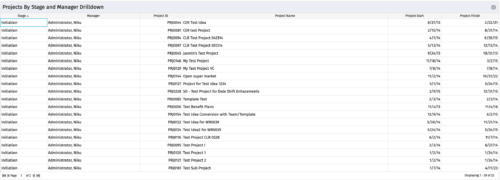
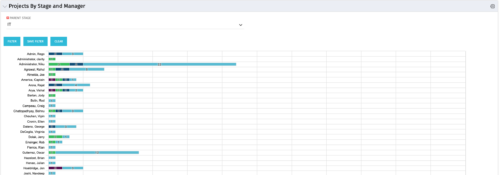 Horizontal Bar Chart displays one bar per manager (manager name on vertical axis). Horizontal axis shows project count. Filtered by Parent Stage. Each bar shows color coded stages, where length of each color is proportional to the count. Data label = count by stage. Mouse-over = stage name and percent count of total projects. Legend = child stage names. Drilldown functionality: Clicking on a bar color yields a project grid portlet with projects in that stage for that manager.
 -
Horizontal Bar Chart displays one bar per manager (manager name on vertical axis). Horizontal axis shows project count. Filtered by Parent Stage. Each bar shows color coded stages, where length of each color is proportional to the count. Data label = count by stage. Mouse-over = stage name and percent count of total projects. Legend = child stage names. Drilldown functionality: Clicking on a bar color yields a project grid portlet with projects in that stage for that manager.
-
 Pie Chart displays counts of all projects by out-of-box Status Indicator attributes. Filterable by OBS structure and Manager. Data label displays count. Mouse-over and Legend display Indicator name. Chart also displays count for projects with no Indicator.
 -
Pie Chart displays counts of all projects by out-of-box Status Indicator attributes. Filterable by OBS structure and Manager. Data label displays count. Mouse-over and Legend display Indicator name. Chart also displays count for projects with no Indicator.
-

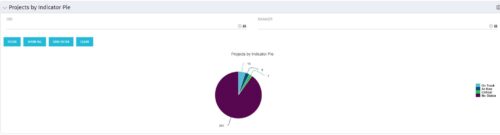
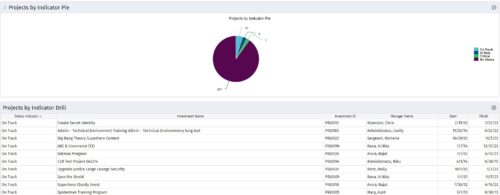 Pie Chart displays counts of all projects by out-of-box Status Indicator attribute. Filterable by OBS structure and Manager. Data label displays count. Mouse-over and Legend display Indicator name. Chart also displays count for projects with no Indicator. By clicking on a pie slice, a grid portlet appears displaying all projects with that indicator value.
 -
Pie Chart displays counts of all projects by out-of-box Status Indicator attribute. Filterable by OBS structure and Manager. Data label displays count. Mouse-over and Legend display Indicator name. Chart also displays count for projects with no Indicator. By clicking on a pie slice, a grid portlet appears displaying all projects with that indicator value.
-
 Pie Chart displays total Ideas by Priority, filterable by Active / Inactive and by OBS structure. Data Label and Mouse-over label display counts by Priority. Legend shows Priority Name. Chart also shows Ideas with No Priority.
 -
 Pie Chart displays count of all Ideas by Department. Filterable by Active and Inactive, by OBS, and by Department Manager. Data label and mouse-over show department counts. Legend displays department names.
 -
Pie Chart displays count of all Ideas by Department. Filterable by Active and Inactive, by OBS, and by Department Manager. Data label and mouse-over show department counts. Legend displays department names.
-
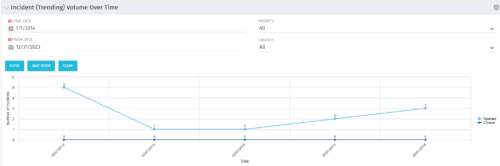 This view depicts trends of created and resolved Incidents over time, grouped by month. The count of incidents opened is determined by the Created Date of the Incident, and the count of Incidents closed is determined by the Resolution Date of the Incident. The view is filterable by Priority and Urgency as well as a date range. NOTE: The values returned are the total sum for a given month, not a cumulative total over time.
 -
This view depicts trends of created and resolved Incidents over time, grouped by month. The count of incidents opened is determined by the Created Date of the Incident, and the count of Incidents closed is determined by the Resolution Date of the Incident. The view is filterable by Priority and Urgency as well as a date range. NOTE: The values returned are the total sum for a given month, not a cumulative total over time.
-
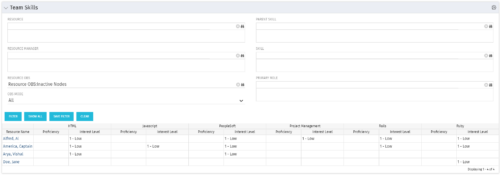 The Team Skills portlet displays Skill Proficiency and Interest Level by Resource. Users can utilize this view to search for Resources by Skill, Parent Skill, Interest, Role, Parent Role, Resource and Resource OBS. This portlet grants a Project Manager or Resource Manager the ability to determine which Resources best fit the needs for their project.
 -
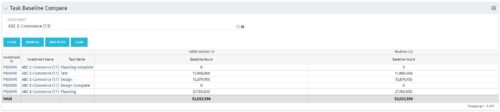 The Task Baseline Compare portlet displays the tasks in a specific Investment and provides the ability to compare the baseline hours for the tasks in each version of the baseline.
 -
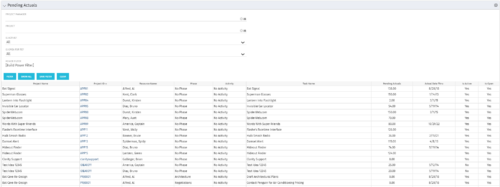 The Pending Actuals portlet displays pending actuals for resources by task. This portlet allows the user to filter on Project, Project Manager, Is Active and Is Open for Time Entry. This portlet provides Resource Managers and Project Managers a simple way to analyse which actuals have been submitted but not posted on specific tasks, as well as the aggregate pending hour total. Note: the information displayed is dependent on what the user has security rights to view.
 -
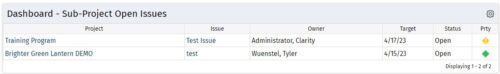 The Program Dashboard Sub-Project Open Issues portlet gives the ability to view issues on sub-projects of a program that are not closed or resolved. The portlet will pull the "id" from the page it is placed on, so this portlet is usually placed on the dashboard tab. The portlet sorts the issues first by priority and then by target date. It displays the sub-project name, issue name, owner, target date, status and priority.
 -
The Program Dashboard Sub-Project Open Issues portlet gives the ability to view issues on sub-projects of a program that are not closed or resolved. The portlet will pull the "id" from the page it is placed on, so this portlet is usually placed on the dashboard tab. The portlet sorts the issues first by priority and then by target date. It displays the sub-project name, issue name, owner, target date, status and priority.
-
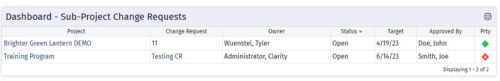 The Program Dashboard Sub-Project Change Requests portlet gives the ability to view all change requests of sub-projects of a program. The portlet will pull the "id" from the page it is placed on, so this portlet is usually placed on the dashboard tab. The portlet sorts the issues first by status, in descending order, and then by target date. It displays the sub-project name, change request name, owner, status, target date, approved by, and the priority.
 -
The Program Dashboard Sub-Project Change Requests portlet gives the ability to view all change requests of sub-projects of a program. The portlet will pull the "id" from the page it is placed on, so this portlet is usually placed on the dashboard tab. The portlet sorts the issues first by status, in descending order, and then by target date. It displays the sub-project name, change request name, owner, status, target date, approved by, and the priority.
-
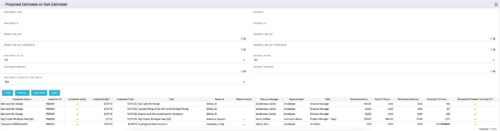 The Proposed Estimates vs. Task Estimates portlet gives the ability to identify when the Proposed Estimates for any given task exceed the Task Estimates. The portlet filters by investment name, investment ID, project OBS unit, investment active (yes/no/all), investment manager, resource name, resource ID, resource OBS unit, resource active (yes/no/all), and resource manager. Additionally, the results can be filtered by the proposed ETC greater than task ETC flag (yes/no/all). The information provided on the portlet includes the investment name, investment ID, investment active (yes/no), investment start/end dates, task name, resource name, resource active (yes/no), resource manager, total hours, total ETC, proposed ETC greater than task ETC flag (yes/no), pending actual hours, and proposed ETC hours.
 -
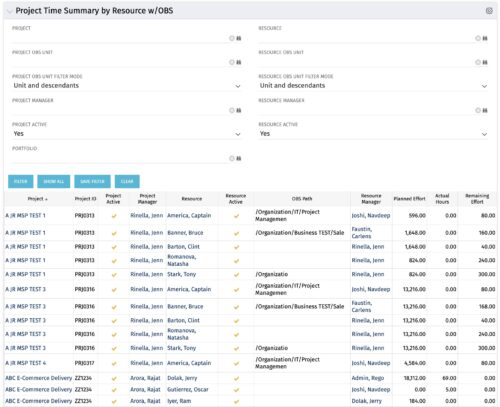 The purpose is to show actual hours, planned effort and remaining effort at the resource level, with the addition of OBS levels to support filtering and manipulation of the exported data.
 -
The purpose is to show actual hours, planned effort and remaining effort at the resource level, with the addition of OBS levels to support filtering and manipulation of the exported data.
-
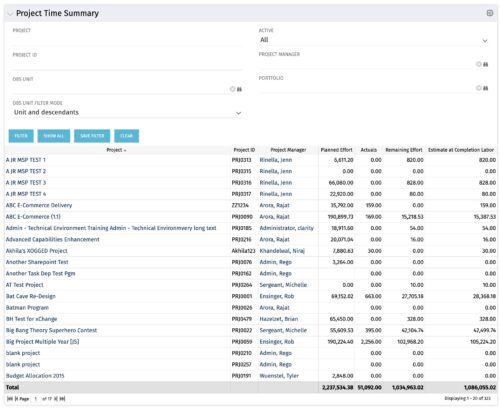 Project managers may use this portlet to show the planned effort and the remaining effort on projects. Includes actual hours as well as estimate at completion. You may narrow the results by filtering by project name, project manager, project OBS, or active flag. The portlet will display each project by ID, name, project manager, planned effort (total allocation hours), actual hours, remaining effort (ETC), and estimate at complete (actual + ETC).


Copyright 2023 • Rego Consulting Corporation • Privacy Policy