-
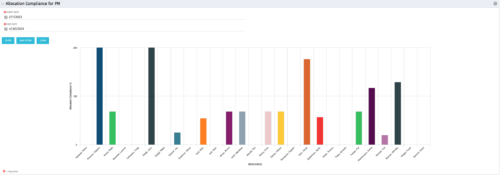 The Allocation Compliance by Person (Project Manager) portlet gives a view of resource allocation compliance for active resources on the team of an investment the logged in user is the manager for. It allows the PM to see resources on their project over the coming months and whether they are over or under allocated. This portlet leverages the daily allocation and daily availability slices as well as only active investments. The portlet provides filters for specific dates, filtering by resource ID, and resource name may also be added.
 -
The Allocation Compliance by Person (Project Manager) portlet gives a view of resource allocation compliance for active resources on the team of an investment the logged in user is the manager for. It allows the PM to see resources on their project over the coming months and whether they are over or under allocated. This portlet leverages the daily allocation and daily availability slices as well as only active investments. The portlet provides filters for specific dates, filtering by resource ID, and resource name may also be added.
-
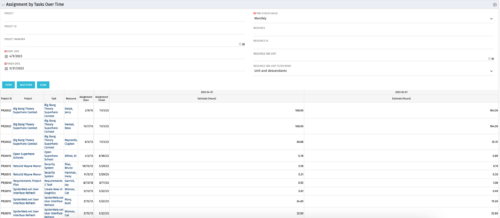 The Assignments by Task Over Time portlet displays all assignments by task for all resources using the timeslices. This portlet is useful for determining which tasks a user is assigned to or how many hours the user is assigned to a task. The user may filter on certain criteria that include: project name/ID, date range, resource name/ID, and resource OBS unit.
 -
The Assignments by Task Over Time portlet displays all assignments by task for all resources using the timeslices. This portlet is useful for determining which tasks a user is assigned to or how many hours the user is assigned to a task. The user may filter on certain criteria that include: project name/ID, date range, resource name/ID, and resource OBS unit.
-

 The Capacity Graph portlet displays Availability, Allocations, Actuals and Assignments for one or more active resource(s) in a single view. This portlet pulls data from timeslices, and allows the user to filter on a weekly, monthly or quarterly data. The Estimated Time to Complete (ETC) and Allocation data will only show for projects that are active. This portlet provides Resource Managers, PMOs and Executives with a simple way to analyse: Allocations vs. Availability, Allocations vs. Actuals, Allocations vs. ETC and ETC vs. Availability. The graph allows the user to determine where areas of improvement may exist and quickly identify potential areas of constraint. Note: the information displayed is dependent on what the user has security rights to view.
 -
The Capacity Graph portlet displays Availability, Allocations, Actuals and Assignments for one or more active resource(s) in a single view. This portlet pulls data from timeslices, and allows the user to filter on a weekly, monthly or quarterly data. The Estimated Time to Complete (ETC) and Allocation data will only show for projects that are active. This portlet provides Resource Managers, PMOs and Executives with a simple way to analyse: Allocations vs. Availability, Allocations vs. Actuals, Allocations vs. ETC and ETC vs. Availability. The graph allows the user to determine where areas of improvement may exist and quickly identify potential areas of constraint. Note: the information displayed is dependent on what the user has security rights to view.
-
 The Capacity Graph - Investment portlet displays Availability, Allocations, Assignments and Actuals for active resources in a single project. This portlet pulls from timeslices and allows the user to filter on weekly, monthly, or quarterly data. This portlet provides a Project Manager with a simple way to analyse: Allocations vs. Actuals and Allocations vs. ETC. Depending on metric goals, the graph allows the user to determine where areas of improvement may exist.
 -
The Capacity Graph - Investment portlet displays Availability, Allocations, Assignments and Actuals for active resources in a single project. This portlet pulls from timeslices and allows the user to filter on weekly, monthly, or quarterly data. This portlet provides a Project Manager with a simple way to analyse: Allocations vs. Actuals and Allocations vs. ETC. Depending on metric goals, the graph allows the user to determine where areas of improvement may exist.
-
 The Capacity Graph portlet displays Availability, Allocations, Actuals and Assignments for a Clarity user in a single view. This portlet pulls data from timeslices, and allows the user to filter on a weekly, monthly or quarterly data. The Estimated Time to Complete (ETC) and Allocation data will only show for projects that are active. This portlet provides a Clarity user with a simple way to analyse their: Allocations vs. Availability, Allocations vs. Actuals, Allocations vs. ETC and ETC vs. Availability. The graph allows the user to determine where areas of improvement may exist and quickly identify potential areas of constraint.
 -
The Capacity Graph portlet displays Availability, Allocations, Actuals and Assignments for a Clarity user in a single view. This portlet pulls data from timeslices, and allows the user to filter on a weekly, monthly or quarterly data. The Estimated Time to Complete (ETC) and Allocation data will only show for projects that are active. This portlet provides a Clarity user with a simple way to analyse their: Allocations vs. Availability, Allocations vs. Actuals, Allocations vs. ETC and ETC vs. Availability. The graph allows the user to determine where areas of improvement may exist and quickly identify potential areas of constraint.
-
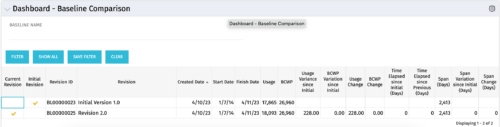 The Dashboard: Baseline Comparison portlet compares multiple baselines on a single project. The portlet is added to the dashboard page of a project and will pull in both baselines for that project and perform a comparison between the two. This portlet provides a quick way for project managers to view the differences between their baselines, especially if they have multiple members updating the project.
 -
The Dashboard: Baseline Comparison portlet compares multiple baselines on a single project. The portlet is added to the dashboard page of a project and will pull in both baselines for that project and perform a comparison between the two. This portlet provides a quick way for project managers to view the differences between their baselines, especially if they have multiple members updating the project.
-
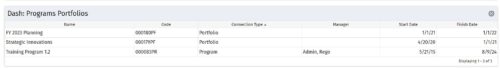 The Dashboard: Programs Portfolios portlet is placed on the dashboard page of a project. This portlet will show any programs or portfolios the project is a subproject of. The portlet will display the name, code, connection type, manager, and start/finish dates.
 -
The Dashboard: Programs Portfolios portlet is placed on the dashboard page of a project. This portlet will show any programs or portfolios the project is a subproject of. The portlet will display the name, code, connection type, manager, and start/finish dates.
-
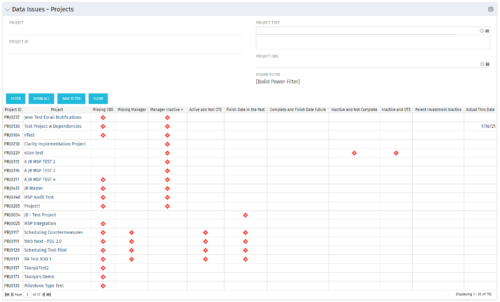 The Project Data Issues portlet is used to identify data exceptions related to project setup. This portlet helps to identify where projects are missing key data or are possibly sitting in an exception state. This view will show projects that have one or many exceptions, including inactive projects. The user may also narrow the results by project, OBS, or project type.
 -
The Project Data Issues portlet is used to identify data exceptions related to project setup. This portlet helps to identify where projects are missing key data or are possibly sitting in an exception state. This view will show projects that have one or many exceptions, including inactive projects. The user may also narrow the results by project, OBS, or project type.
-
 The Resource Data Issues portlet is used to identify data exceptions related to resource setup. This portlet helps to identify where resources are missing key data or are possibly sitting in an exception state. This view will show resources that have one or many exceptions, including inactive resources. There is no security built into this portlet - all resources will show. The only required field in the filter is Days, which is the number of days since the user last logged in. The user may also narrow the results by resource, OBS, or project type.


Copyright 2023 • Rego Consulting Corporation • Privacy Policy