-
 This video describes the process to Autoschedule a project using OWB. The video is available in both .m4v and .wmv formats.
 -
 This training document is a Rego Consulting Quick Reference Guide to assist with the utilization of Tasks and To Do’s in Clarity’s Modern User Experience. This doc references version 16.0.2 views.
 -
 A Quick Reference Guide to assist in the creation of Tasks using the Clarity Gantt. The screen shots utilize the Classic UX with the Phoenix theme.
 -
 A Quick Reference Guide that covers how to staff a Team in Clarity’s Modern UX. It reviewes some of the key terminology, covers Allocation vs. ETC, accessing the Staffing Tab, and viewing time-scaled allocations.
 -
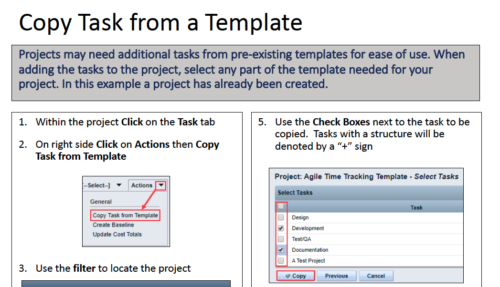 Projects may need additional tasks from pre-existing templates for ease of use. When adding the tasks to the project, select any part of the template needed for your project. In this Quick Reference Guide, a project has already been created.
 -
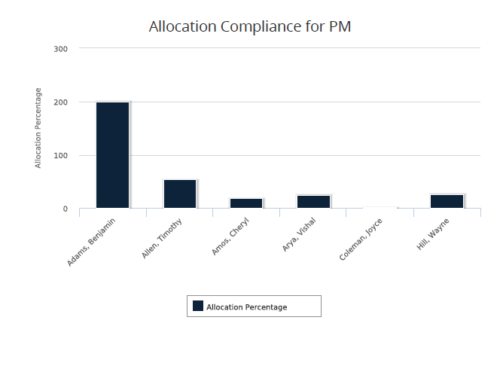 Allocation Compliance for PM report gives a view of resource Allocation percentage for active resources on the team of an investment for a selected Investment Manager. It allows the PM to see resources on their project over the coming months and whether they are over or under allocated. Allocation Percentage is calculated as (‘Allocated Hours’ / ‘Available Hours’) * 100. User can further narrow their search Month Start Date and Investment Manager. User can use exact dates or relative dates for Month Start Date filter parameter.
 -
 Course description: “Are some of your users leveraging a Smartsheet add-on for project planning, or are you looking for an alternative to OWB and MSP? Learn how this new scheduling tool is making waves and adding value for project managers working within CA PPM.” Download file is the presentation slidedeck.
 -
 The interface runs using a MS Excel template called Project Allocation Upload that will be distributed to users.
- Configuration
- A master object called Allocation Upload Files will be created. The object will contain a required attachment field on the create page that will receive the Project Allocation Upload MS Excel file.
- A new sub-object called Allocation Upload Records will be created. This object will contain the fields necessary to receive the data rows from the Project Allocation Upload template.
- The master object will store the file level data while the sub-object will store the rows that belong to the file.
- Users must be granted security to view and edit the master and sub-objects in order to run the upload process.
- Project Allocation Upload Template
- The Project Allocation Upload template must remain static. Any changes other than creating additional time periods or additional rows will cause the process to error.
- Only the Project Allocation Upload template can be used to load records to the new objects.
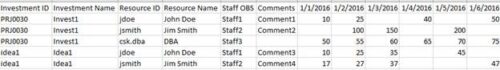
- The Project Allocation Upload will only accept months across the x-axis in the format DD/MM/YYYY. The month headers must appear in the first row of the template and contain the first day of the month.
- The template must be distributed to the users that will be using the upload functionality.
- Users will be required to enter an Investment ID and Resource ID so the process can correctly identify investments and resources to upload the allocation hours against.
- A Staff OBS is not required but can be populated by users to have the data uploaded into CA PPM.
- The owner of the Project Allocation Upload template is responsible for providing users a valid list of Staff OBS Units.
- Investments will not be created through the interface. As such a valid Investment ID must be provided.
- Resources can be added to the investment team through the interface. If a valid Resource ID is provided the resource’s allocation will be updated if the resource already exists on the investment. If the resource does not already exist on the investment the resource will be added to the team along with the allocation hours.
- The Project Allocation Upload template will accept hours, not allocation percentages. Because CA PPM stores allocations as percentages of a resource’s availability the upload process must convert hours to a percentage. As a result small rounding errors may occur in the neighborhood of .01 hours per month.
- Resources cannot be removed from investment teams through the interface.
- The Project Allocation Upload template will support allocation uploads to different instances of the same role on the same investment as long as different Staff OBS units are provided.
- If multiple instances of the same role are assigned to the investment with the same Staff OBS the process will not know which instance of the role to upload the hours to. In these cases the process will consider these records as invalid. The PM will need to manually remove one of the instances or upload the hours manually..
- If multiple instances of the same role with the same Staff OBS unit are assigned to the same investment in the upload template the monthly hours will be totaled by investment, by role, by Staff OBS.
- The allocation template will follow the format in the screenshot area.
- Process
- To initiate the Allocation Interface a user will create a new Allocation Upload File instance, attach the Project Allocation Upload Template, and save the record. The file attachment field is an “enter-once” field, meaning that once a value has been set it cannot be changed. If a user wishes to upload another field they will create a new record.
- After the file has been attached the user will be presented with two check box fields, one to Validate and one to Validate and Upload. Checking either or both options will initiate the process.
- The process will first determine if any sub-object instances exist for the file. In other words, do any records already exist in the Allocation Upload Records sub-object pertaining to the newly uploaded file. If there are no records in the sub-object the process will use the uploaded file and read its contents into the sub-object. If errors are encountered during the file read they will be written to the process console, the process will throw an error, and end.
- Next, records will be validated. Only the sub-object instances that belong to the master object will be validated. Records belonging to other master object instances will not be validated or processed. All records in a status of Ready for Processing, Failed Validation, or Xog Load Error will be validated. Records will fail validation if an investment is not found corresponding to the investment ID provided, a resource is not found corresponding to the resource ID provided, or the date provided is not valid, or a provided Staff OBS does not yield a match. Records that fail validation will be flagged as invalid along with a description as to why they failed validation. Records that pass validation will be flagged as Ready for Processing and locked. The sub-object instances can be exported to excel if further analysis is required. If the Validate & Upload option was not selected the process will end here.
- Regarding the Staff OBS. Only one OBS can be designed as the OBS that the interface will use to validate the Staff OBS records.
- The Staff OBS value from the template must match against the name of an OBS node in the designed Staff OBS.
- If the Staff OBS value matches against multiple nodes in the Staff OBS the record will be flagged as invalid as the process will not know which node to use.
- If the Validate & Upload option was selected the process will continue and any valid records will be xog’ed into the investment team. The xog will be executed as the user that initiated the process so any security rules enforced by xog will be respected by the process.
- Successful records will be flagged as Processed Successfully in the sub-object and remain locked. Records that did not load successfully, due to a xog error or security limitation will be flagged as Xog Load Error, unlocked, and updated with a description containing the full xog output.
- Records that failed validation or failed the xog load can be manually edited and revalidated, and attempt to be uploaded again. Subsequent runs of the process will not read in data from the file, but rather process only sub-object instances that currently exist.
- Configuration
-
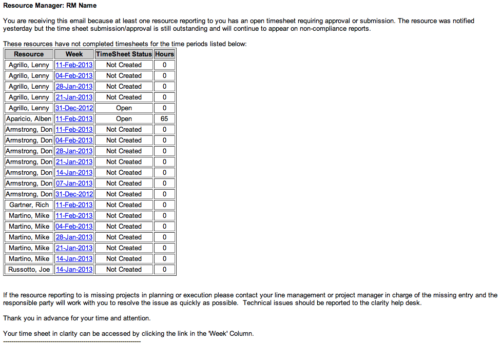 The Time Tracking Stalker - RM workflow process automatically sends an email to Resource Managers for each one of their resources that have not submitted their timesheet for a prior open time period, thus informing the RM if their resources are submitting their timesheets on time. Project Managers will also benefit since the notifications will help to ensure that time is being posted against their projects in a timely manner, helping to provide them with an accurate view of time expended on the projects.
 -
 The Status Report Publish workflow process pushes values from the status report sub-object to the parent project object. The process is started when the user ticks the “Publish” Boolean field on the status report (custom field added). This workflow will update the project object with the overall status indicator, the status comment, the previous overall status, and the as of date. This eliminates the project manager having to update the fields in both the status report and the project overall.
 -
 The Re-Baseline via Change Request process is a simple method for a member of the project (who has the ability to create change requests) to request a re-baseline of the project without the project manager having to perform it. First, the user must create the change request. The user must then start the process within the change request by using the Processes tab. Once started, the process will route an action item to the Project Manager. If rejected, the process will end and the user must start it again (if needed). If approved, the process will then baseline the project and close out the change request.
 -

- ITFM Introduction
- PMO & IT Finance Collaboration
- Where ITFM and PPM Meet
- Connecting PPM with ITFM


Copyright 2023 • Rego Consulting Corporation • Privacy Policy