-

 Pie Chart displays projects by Baseline Finish Variance—is current project finish beyond baseline finish; or is current project finish on or before baseline finish. Filterable by OBS structure and Finish Date range. Data labels show percent within baseline vs percent outside baseline. Mouse-over shows Within or Outside label and percent of total projects. Legend shows color coded Within Baseline and Outside Baseline labels. Drilldown: Clicking on a pie slice yields a grid portlet of projects either Within or Outside Baseline.
 -
Pie Chart displays projects by Baseline Finish Variance—is current project finish beyond baseline finish; or is current project finish on or before baseline finish. Filterable by OBS structure and Finish Date range. Data labels show percent within baseline vs percent outside baseline. Mouse-over shows Within or Outside label and percent of total projects. Legend shows color coded Within Baseline and Outside Baseline labels. Drilldown: Clicking on a pie slice yields a grid portlet of projects either Within or Outside Baseline.
-
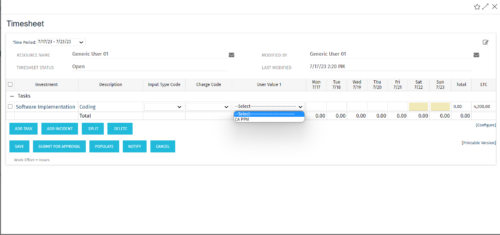 The tech-trick shows how to retrieve logged in User related values (ex: skill set) in timesheet.
 -
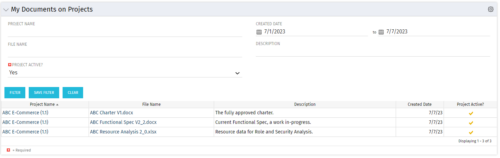 This Portlet allows users to quickly access Documents they uploaded into Projects via the Classic UI à Collaboration tab or via the New UX Documents module. Clicking on the File Name downloads the file, clicking on the Options gear allows users to export the list to Excel.
 -
 A Quick Reference Guide that reviews access to Project Tasks and Task To Dos in Clarity PPM’s Modern UX.
 -
 A slide deck that reviews the processes for time entry and approval of timesheets in Clarity’s Modern UX. Used for Rego’s training engagements, it covers the Time Entry process via flow chart, steps for submitting a timesheet, adjusting a returned timesheet, and adding or removing tasks from a timesheet.
 -
 A slide deck used in Rego’s training classed for Project Management in the Modern User Experience. Reviews terms and definitions, the OBS, Work Breakdown Structure, Templates, Roles and Responsibilities, Allocation vs ETC, Accessing Projects, Project Creation, Staffing, Tasks, Assignments, To Dos, Project Financials, and more.
 -
 A Quick Reference Guide to assist in the population of the Project Property Details. Reviews accessing and updating the project property details. Also shows alternative in-line edits.
 -
 A Quick Reference Guide that covers how to staff a Team in Clarity’s Modern UX. It reviewes some of the key terminology, covers Allocation vs. ETC, accessing the Staffing Tab, and viewing time-scaled allocations.
 -
 A Quick Reference Guide to assist in managing project task in Clarity’s Modern UX via the Task List Tab. Provides a quick review of WBS, accessing the Task List Tab, the associate Sub Tabs, task level conversations, Task To Do’s, Task Assignments, and Task Properties.
 -
 A Quick Reference Guide to assist in managing project task in Clarity’s Modern UX via the Task List Tab. Reviews accessing the Task Tab, manage task in the Grid, Board and Timeline views.
 -
 A Quick Reference Guide that assists in managing project tasks in Clarity’s Modern UX via the Classic Gantt. Reviews how to open the Project Scheduler and use of the Gantt View.
 -
 A Quick Reference Guide that covers task assignments in Clarity’s Modern UX. The guide reviews the Assignment Tab and updating ETC via two options.
 -
 A Quick Reference guide to assist in the creation and management of project cost and budget plans in Clarity’s Modern UX. Reviews the access of project details from the Project Grid or Tile views, creation of a cost and budget plan, and edits to those plans.
 -
 A Quick Reference Guide to assist in the creation and management of Status Reports in Clarity’s Modern UX. Reviews accessing the project details from the grid or tile view, creation of a new status report, existing status reports in Classic, updating status reports, customizing project status, and the project status list view.
 -
 A slide deck from Rego’s training class on Portfolio Management using Clarity’s Classic UX. Covers an introduction to Portfolio Management including definition, portfolio contents, PfM roles and responsibilities, how portfolios work, data used, key deliverables, prerequisites for starting PfM, and PfM security.
 -
 A Rego training deck that walks through the various aspects of Open Workbench and offers tips and trick on using the tool to manage projects in sync with Clarity. Covers: Opening a plan, Multiple Staffing, Preference Options, Quick Access Toolbar, Quick Search and Quick Filter, Views and Filters, Copying Plans, Work Breakdown Structure, Dependencies, Assignments, Autoschedule, Baselining and Plan Closure.
 -
 Rego’s training deck for Project Management in Clarity using the Classic UX and the Phoenix theme. Reviews the OBS, WBS, Templates, Terms, Allocation vs ETC and more.
 -
 A Quick Reference Guide to assist in creating a project from a template in Clarity’s Classic UX. Document uses screen shots to walk through the process. Document uses the Phoenix Theme.
 -
 A Quick Reference Guide to assist in the process of populating Project Properties. The document uses screen shots from the Classic UX with the Phoenix theme.
 -
 A Quick Reference Guide to assist in the process of staffing a Project Team in Clarity. The document uses screen shots from the Classic UX with the Phoenix theme.
 -
 A Quick Reference Guide to assist in the creation and editing of tasks using the Project Task List in Clarity. Screen shots are from the Classic UI, using the Phoenix Theme.
 -
 A Quick Reference Guide to assist in the creation of Tasks using the Clarity Gantt. The screen shots utilize the Classic UX with the Phoenix theme.
 -
 A Quick Reference Guide to assist with Task Assignments in Clarity. The document shows screen shots from the Classic UX with the Phoenix theme.
 -
 A Quick Reference Guide to assist in the creation of risks, issues and change requests in Clarity. The document show this with screenshots from the Classic UX with the Phoenix theme.
 -
 A Quick Reference Guide to assist with the creating and managing of Cost Plans in Clarity. The document uses screen shots from the Classic UX using the Phoenix theme.
 -
 A Quick Reference Guide to assist in the creation of a Project Status Report in Clarity. The document uses screen shots from the Classic UX with the Phoenix theme.
 -
 A Quick Reference Guide to assist in creating and editing Project Baselines in Clarity Classic with the Phoenix theme.
 -
 A Quick Reference Guide to assist in the process of converting a Idea into an Investment in Clarity. Includes information on adding financial and resource data into the new investment.
 -
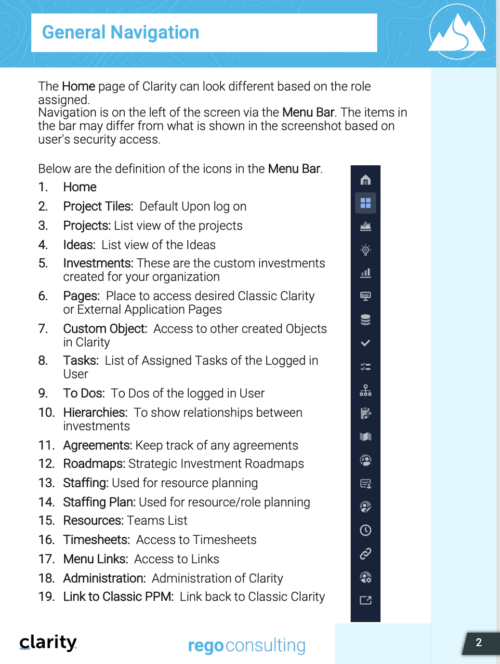
 This training document is a Rego Consulting Quick Reference Guide to assist with General Navigation in Clarity’s Modern User Experience. This doc references version 16.0 views. Doc reviews the Menu Bar and User Tool Bar.
 -
 This training document is a Rego Consulting Quick Reference Guide to assist with the My Tasks View in Clarity’s Modern User Experience. Guide shows how Tasks are access by use of the Task icon in the menu.
 -
 This training document is a Rego Consulting Quick Reference Guide to assist with the use of the To Dos functionality in Clarity. It illustrates accessing the To Do list from the Menu and then the functionality of the To Do page.
 -
 This training document is a Rego Consulting Quick Reference Guide to assist with use of the Common Grid. You can find the grid throughout the application to manage projects, tasks, roadmaps, ideas, and timesheets to name a few. The QRG reviews View Options, Column Adjustments, the Details Panel and more.
 -
 This training document is a Rego Consulting Quick Reference Guide to assist with the process of converting an idea to a project in Clarity’s Modern User Experience.


Copyright 2023 • Rego Consulting Corporation • Privacy Policy